


Week's Price Volume Action - 18th Nov'23
All the Price Volume action at one place !

Hello All,
The new week is to start, and here are your in-depth volume price stats on the Indian stock markets. What stories did the numbers tell us this week? Let's find out. In case you are new here, the
about page for our Newsletter is here and the
last week’s newsletter is here!
Lets Goooo!
How have the Sectors panned out this week?

**
1184 - BSE Enhanced Value Index
1186 - BSE Momentum Index
1180 - BSE 250Smallcap Index
Top 5 Indices this Week

Top 5 Indices this Month

Nifty 50

Nifty Returns over different periods
35 companies gave >5% returns in last 1 year while same number is 39 in last 6 months.
While 8 companies gave < -5% returns in last Year. These are Adani Ent., Adani Ports, Infy, UPL, SBI, HDFC Bank, Reliance Ind & Kotak Bank.

Nifty PE (Red) and Nifty Price (Black) Chart
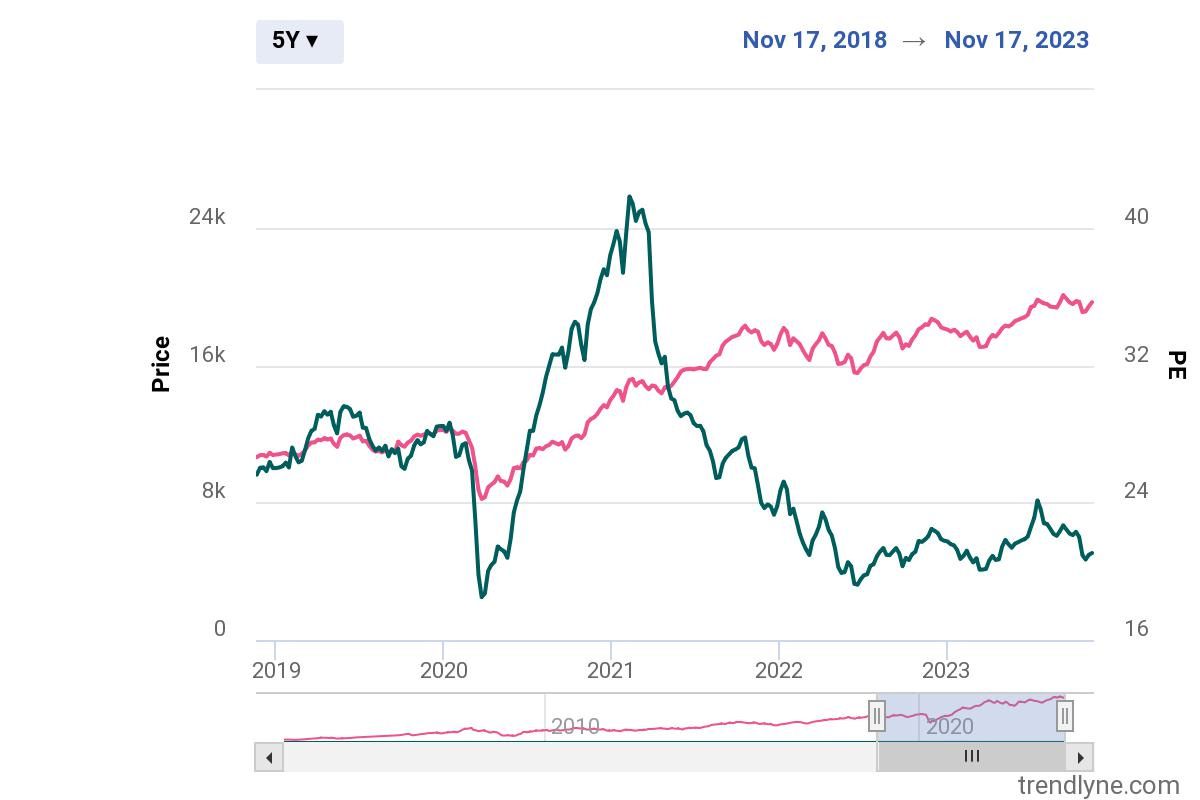
Nifty 50 PE Ratio

Stocks Touching 10 year high !

Top Weekly Gainers

Highest Volume Stocks with Good fundamentals :
These are stocks with their End of day BSE+NSE delivery volume trading 2 times of Avg Month NSE+BSE Delivery volume. Volume Multiplier is ratio of delivery of Volume at the end of the day to Average delivery volume for the Month. This indicates
- a surge in investor interest or trading activity.
- increased volatility (Opportunity for Short term).
- speculative risk.
- Improved liquidity.

It's important to note that while increased delivery volume can be a sign of significant market interest, it does not guarantee that the stock will perform well (upside/downside) in the future.
Traders and investors should consider various other factors, such as company fundamentals, market conditions, and their own investment objectives, before making decisions based solely on trading volume data. Additionally, past performance is not indicative of future results, so thorough research and risk management are essential in any strategy.
These are not recommendations to buy or sell !!
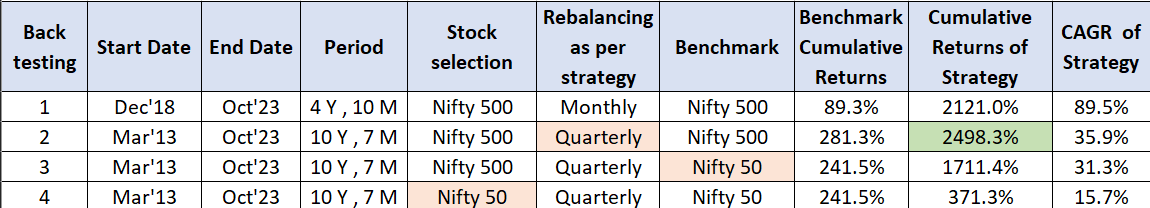
Back testing
Now, lets see the back test of this strategy over a different periods. The stock selection means that the stocks being selected are either from Nifty 50 or Nifty 500.
Tried out rebalancing of such selected stocks on a different frequencies like monthly or quarterly so that we give the stock a change to perform over such periods and then compare and then do the selection/deselection of the portfolio. Also, to compare the returns, have selected the benchmark performance as Nifty 50/500.
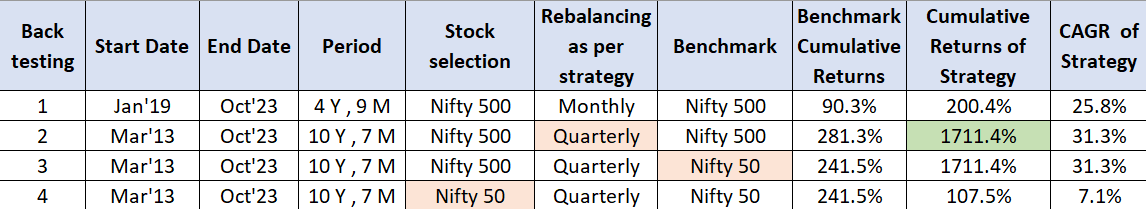
The above comparison gives the strategy 2 as the best strategy keeping quarterly as the best refresh and Nifty 500 as the optimum pool for stock selection. I have checked returns of Nifty 50 as well (Strategy 3) and the benchmark returns have dropped from 281% to 241%.
As per this strategy, if the rebalancing is reduced to Monthly (Strategy 1) the returns drop significantly.
If we limit the stock selection to Nifty 50 (Strategy 4), the strategy returns drop to a meagre 107% which is below par the Nifty50 CAGR.
Stocks At 52 Week High

All time high Stocks are important to track and how they have historically provided returns is shown below.
I have taken a period of 5 years to back test this and compared the returns with Nifty500 Benchmark.
Stocks with estimated High Bullishness from Analysts
Sum of strong Buy and buy calls from analysts, so HDFC Bank has 36 ‘BUY’ calls while IndusInd Bank has 35 ‘BUY’ calls.

Leaders with Current Price below 200Day EMA
(Excluding Volatile stocks)

Near 52 Week Low

Top Weekly losers

Stocks with estimated High Bearishness from Analysts
Sum of strong sell and sell calls from analysts, so Lupin has 17 ‘SELL’ calls while Shree Cements has 15
‘SELL’ calls.

5 Interesting Stocks
Titagarh Rail

Narayana Hrudalaya

SBI Life Insurance

Hi-tech Gears

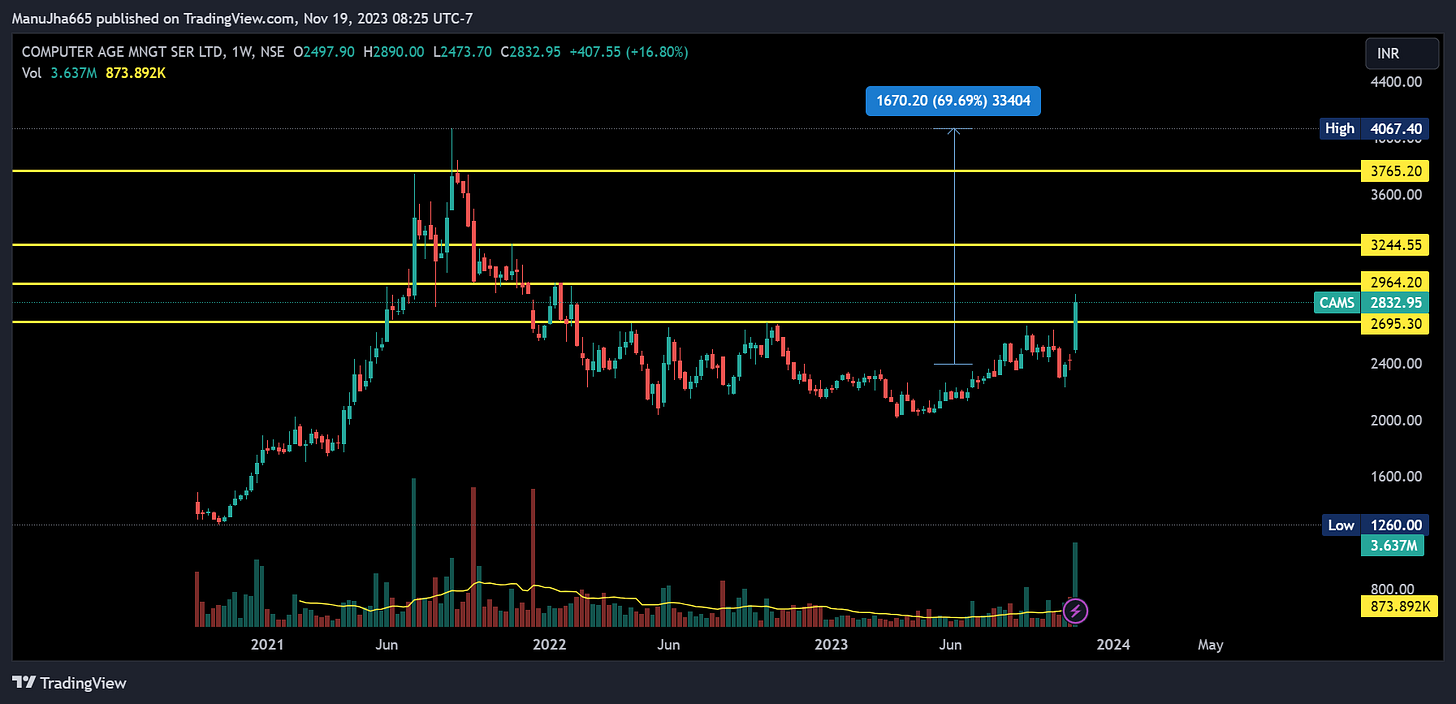
CAMS


Thanks for reading till now. I hope these 5-7 mins have added some value in your analysis.
There is a lot more to come, and I look forward ahead.
Will catch up next weekend!
Thanks,
Curious Investor