


Week's Price Volume Action - 2nd Feb'24
All the Price Volume action at one place !

Hello All,
The new week is to start and here are your in-depth volume price stats on the Indian stock markets. What stories did the numbers tell us this week? Let's find out. In case you are new here, the about page for our Newsletter is here and the
last newsletter is here!
Now Lets Goooo !
How have the Sectors panned out last week?
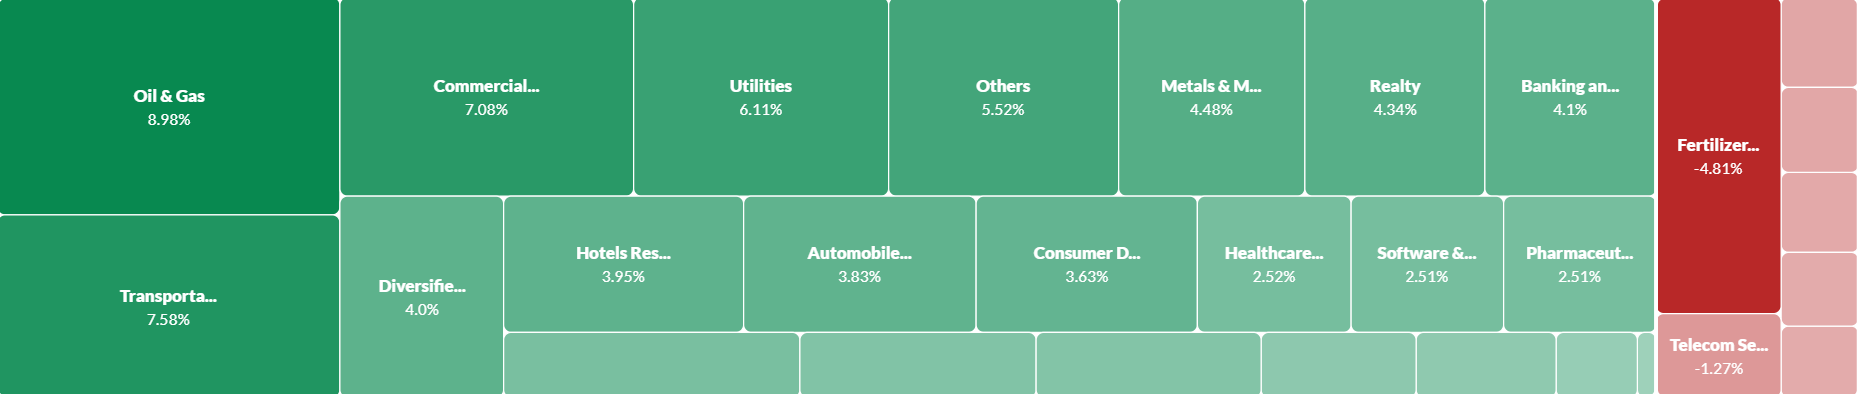
Table toppers - Oil & Gas:
Top 10 movers from ( >1000cr Mcap & >10 % Weekly Change)
- Tidewater Oil - 28%
- BPCL- 18%
- Savita Oil- 16%
- Gulf Oil- 14%
-HPCL - 13%
-IOCL - 13%
-Chennai Petroleum - 12%
-Oil India - 11%
-ONGC - 10%
-Mangalore Refinery - 10%
Top 5 Indices this Week

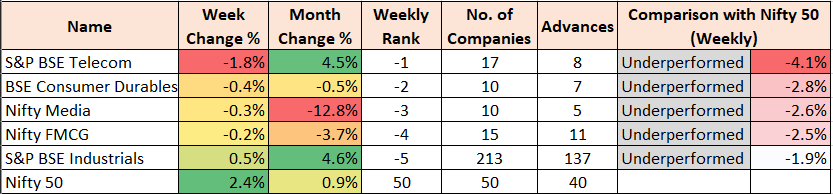
Bottom 5 Indices this Week
Top 5 Indices this Month

Bottom 5 Indices this Month
Indices Performances HeatMap

Nifty 50

Nifty Returns over different periods
Out of 50, 46 companies gave >5% returns in last 1 year and 39 gave >5% in last 6 months. 28 have beaten the Nifty 50 returns (24.1%) in last 1 year. 22 out of the 28, have an alpha over Nifty50 by > 10 %
Out of 50, 13 companies gave >50% returns in last 1 year - Adani Ports, Bajaj Auto, Adani Enterprises, NTPC Ltd., Tata Motors, ONGC , L&T, Coal India, Hero Moto, Tata Consumer, , BPCL, Power Grid & Titan .
While only 3 companies gave negative returns in last 1 year. These are UPL (-23%), HDFC BANK (-10%) & HUL (-7%) .

Nifty PE (Black) and Nifty Price (Pink) Chart
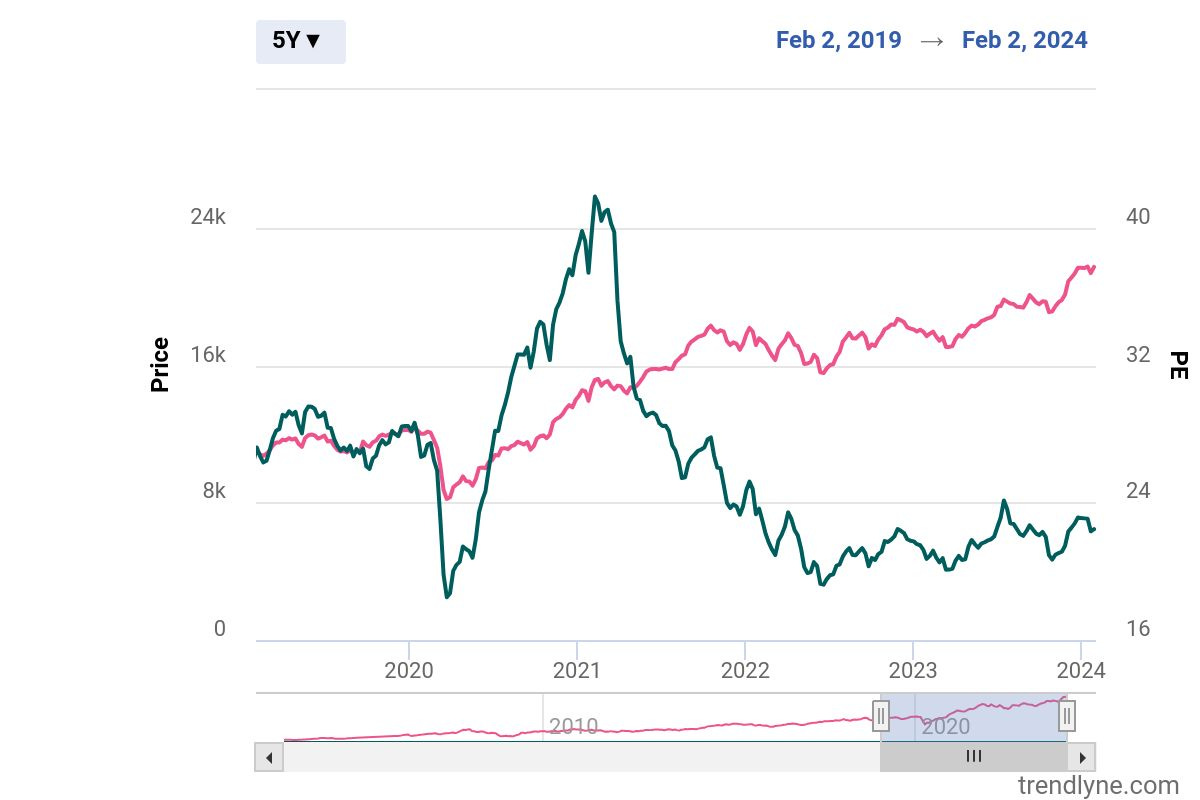
Nifty 50 PE Ratio
The Current PE = 22.5 and Avg PE at different time periods are :
1M = 22.8 3M = 22.3 6M = 22.2
1Y = 21.9 2Y = 21.5 5Y = 26.0

Stocks Touching 10 year high !

Top Weekly Gainers

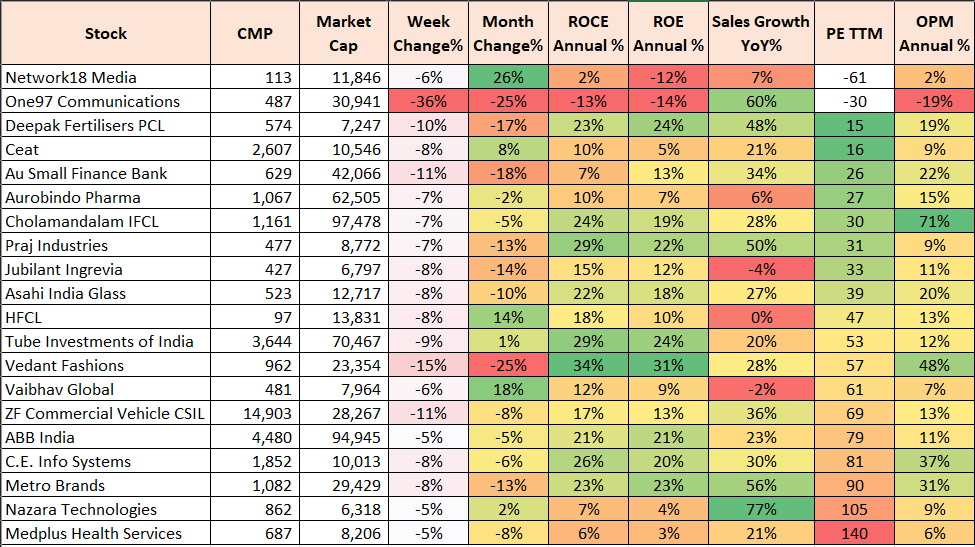
Highest Volume Stocks with Good fundamentals :
These are stocks with their End of day BSE+NSE delivery volume trading 2 times of Avg Month NSE+BSE Delivery volume. Volume Multiplier is ratio of delivery of Volume at the end of the day to Average delivery volume for the Month. This indicates
- a surge in investor interest or trading activity.
- increased volatility (Opportunity for Short term).
- speculative risk.
- Improved liquidity.

It's important to note that while increased delivery volume can be a sign of significant market interest, it does not guarantee that the stock will perform well (upside/downside) in the future.
Traders and investors should consider various other factors, such as company fundamentals, market conditions, and their own investment objectives, before making decisions based solely on trading volume data. Additionally, past performance is not indicative of future results, so thorough research and risk management are essential in any strategy.
These are not recommendations to buy or sell !!
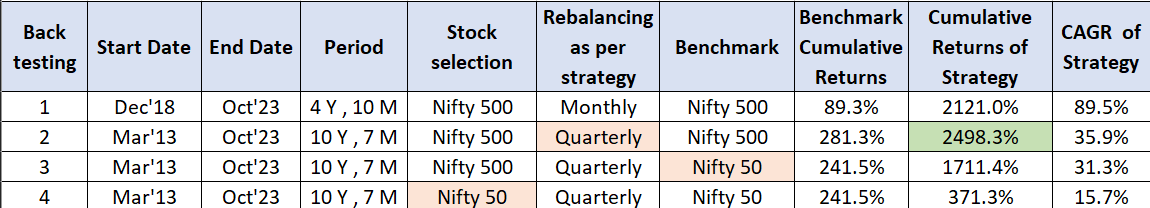
Back testing
Now, lets see the back test of this strategy over a different periods. The stock selection means that the stocks being selected are either from Nifty 50 or Nifty 500.
Tried out rebalancing of such selected stocks on a different frequencies like monthly or quarterly so that we give the stock a change to perform over such periods and then compare and then do the selection/deselection of the portfolio. Also, to compare the returns, have selected the benchmark performance as Nifty 50/500.
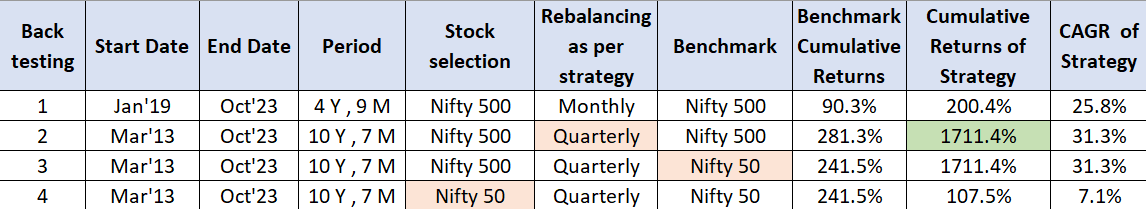
The above comparison gives the strategy 2 as the best strategy keeping quarterly as the best refresh and Nifty 500 as the optimum pool for stock selection. I have checked returns of Nifty 50 as well (Strategy 3) and the benchmark returns have dropped from 281% to 241%.
As per this strategy, if the rebalancing is reduced to Monthly (Strategy 1) the returns drop significantly.
If we limit the stock selection to Nifty 50 (Strategy 4), the strategy returns drop to a meagre 107% which is below par the Nifty50 CAGR.
Stocks At 52 Week High

All time high Stocks are important to track and how they have historically provided returns is shown below.
I have taken a period of 5 years to back test this and compared the returns with Nifty500 Benchmark.
Stocks with estimated High Bullishness from Analysts

Leaders with Current Price below 200Day EMA

Near 52 Week Low

Top Weekly losers
5 Interesting Stocks
NBCC

Bank Of Baroda

National ALuminium

Mangalore Refinery

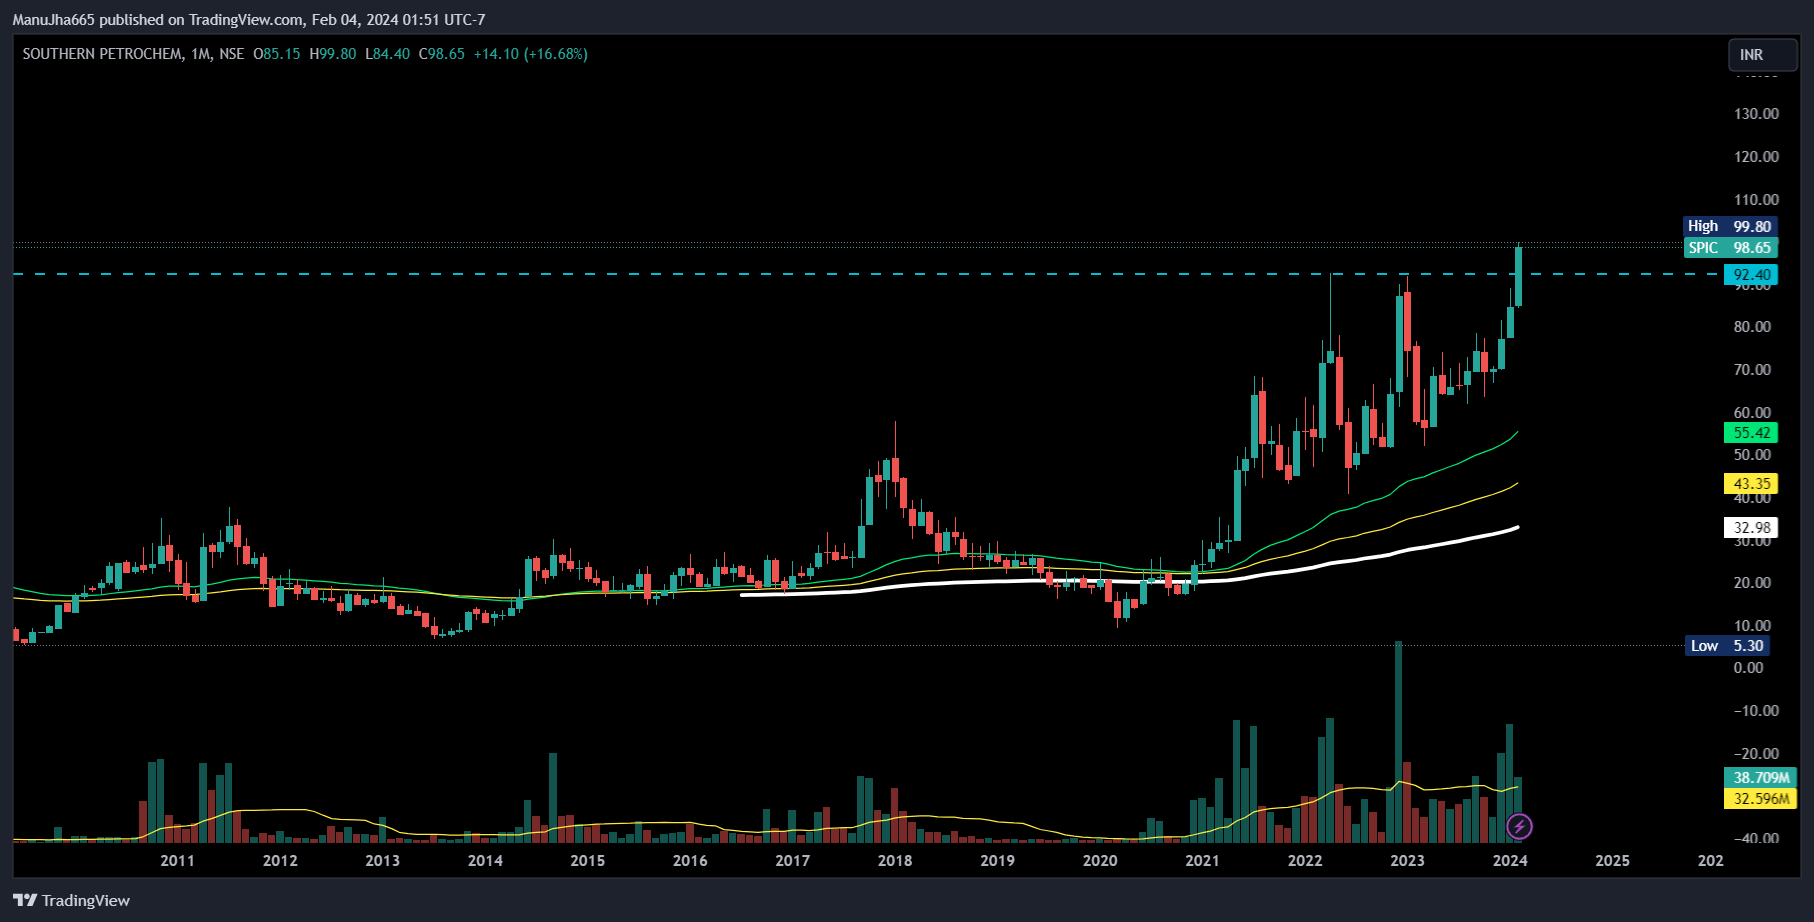
Southern PetroChem SPIC
Thanks for reading till now. I hope these 5-7 mins have added some value in your analysis.
There is a lot more to come, and I look forward ahead.
Thanks,
Curious Investor
Disclaimer: The information provided in this article is for informational purposes only and should not be construed as investment advice. The analysis and insights presented are based on publicly available information, and while efforts have been made to ensure accuracy, we cannot guarantee the completeness or reliability of the information.
Investing in securities carries inherent risks. This post should not be relied upon as a substitute for independent research or consultation with a qualified financial advisor.
The author of this post and the platform on which it is published do not provide personalized investment recommendations or financial advisory services. Any investment or trading decisions you make based on the information provided in this post are solely at your own risk.
Neither the author nor the platform shall be held responsible or liable for any loss or damage arising directly or indirectly from the use of or reliance on the information contained in this post. Readers are encouraged to conduct their own due diligence and seek professional advice before making any investment decisions.
By accessing and reading this post, you acknowledge and agree to the terms and conditions outlined in this disclaimer.
.