


Evaluating the Nifty Bank Index: Growth, Value, and Opportunity
Is this the right time ?

The Indian stock market offers a plethora of investment opportunities, each with its unique set of advantages and risks. Among these, the Nifty Bank Index stands out as one of the prominent benchmarks, representing the health and performance of the country's banking sector.
As the trend towards passive investing gains momentum globally and in India, understanding the intricacies of this index becomes crucial for investors looking to harness its potential.
In this comprehensive guide, we delve into the dynamics of active versus passive investing, the benefits of passive strategies, and the compelling reasons to consider investing in the Nifty Bank Index.
From its composition and valuation metrics to growth prospects and historical performance, we provide an in-depth analysis to help you make informed investment decisions in this pivotal segment of the market.
In this article, we’ll go through :
Whats Passive investing ? Its Pros & Cons
Differnce between Index Fund and ETF
Construct of Nifty Bank Index
Growth Opportunity
Reasons of Growth trajectory
Past Performance - Rolling returns
Risks
Possible Headwinds
First, lets first understand what is passive investing.
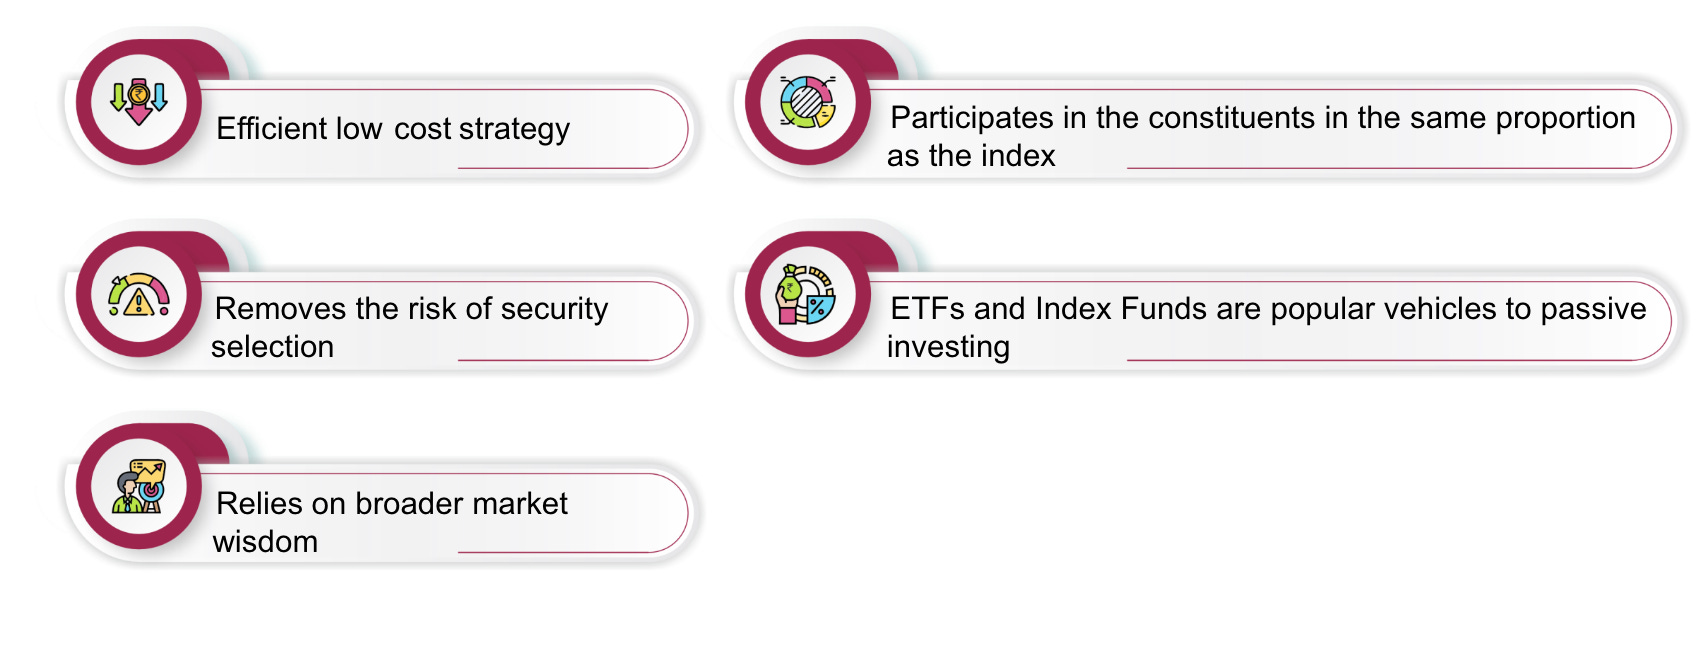
Passive Investing
Low friction investment strategy tracking a pre-specified benchmark/index as closely as possible.
Passive investing is a strategy where investors aim to replicate the performance of a specific index or benchmark, rather than attempting to outperform it. This approach involves buying and holding a diversified portfolio of assets that mirror the components of the chosen index, such as the Nifty 50 or S&P 500. The primary goal is to achieve similar returns to the index over the long term, minimizing trading and associated costs.
Rising popularity of Passive Strategies in India
The AUM of passive strategies in India has grown approximately 6.5 times over the last five years, reaching ₹10 lacs crores as of March 2024, up from ₹1.5 lacs crores in March 2019.
Factors Driving Popularity:
Cost Efficiency: Passive funds generally have lower expense ratios compared to actively managed funds, making them an attractive option for cost-conscious investors.
Performance: By tracking an index, passive funds often provide competitive returns relative to active funds.
Transparency: The holdings of passive funds are typically more transparent since they aim to replicate a known index

Source: MFI Explorer, Axis MF Research Data as on 31st March 2024. Includes Exchange Traded Funds, Fund of Funds (Domestic and Overseas) and Index Funds as categorized by AMFI. T
The Pros & Cons

There are two ways how investors can gain exposure through Passive Investing.
ETFs
Index Funds
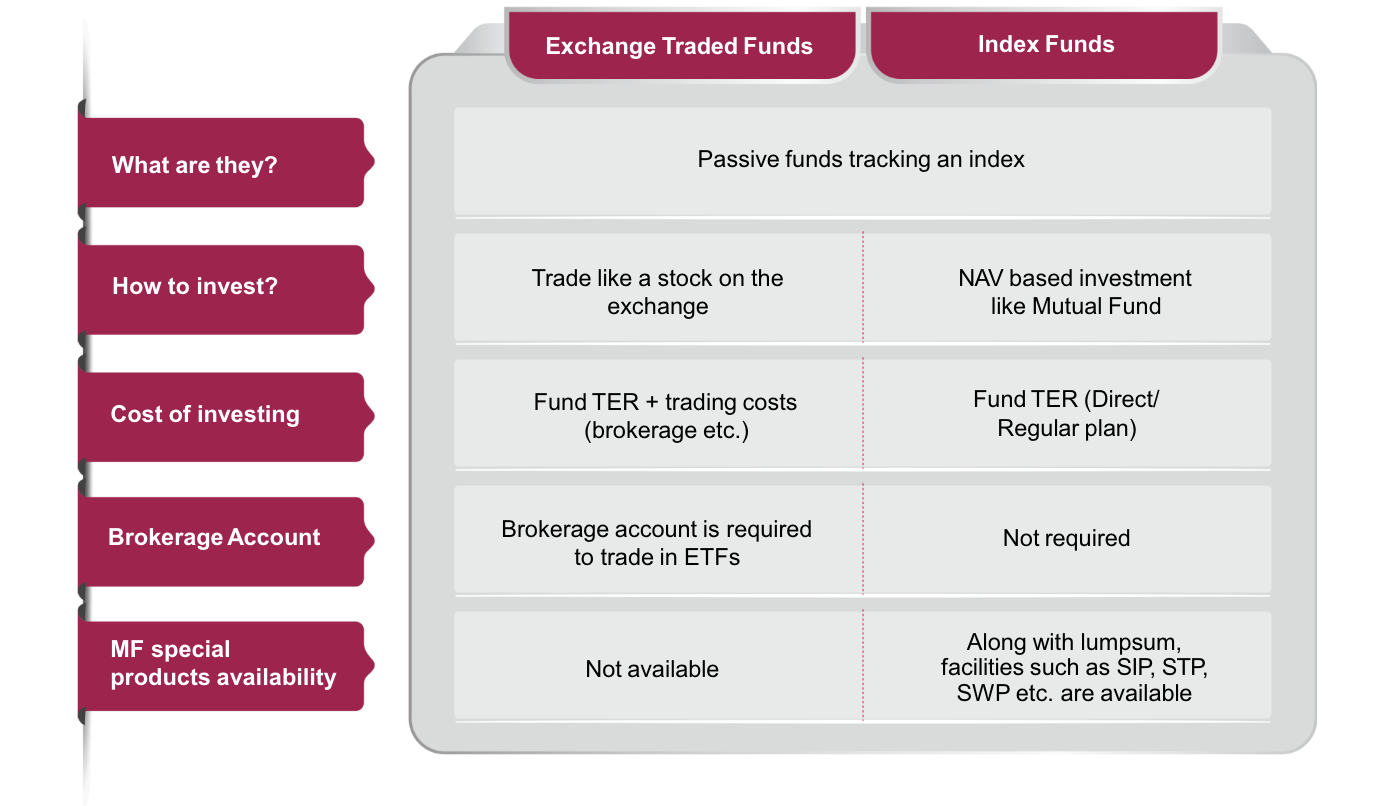
Both index funds and ETFs provide passive investors with straightforward ways to gain exposure to various asset classes or market segments, allowing them to participate in market returns with minimal active management. The choice between the two often depends on factors such as liquidity preferences, trading flexibility, cost considerations, and tax efficiency.
Index Funds vs ETF’s
Now lets move on to the Nify Bank Index.
Nifty Bank Index
Nifty Bank Index is comprised of the most liquid and large capitalised Indian Banking stocks. It provides investors and market intermediaries with a benchmark that captures the capital market performance of Indian Banks.
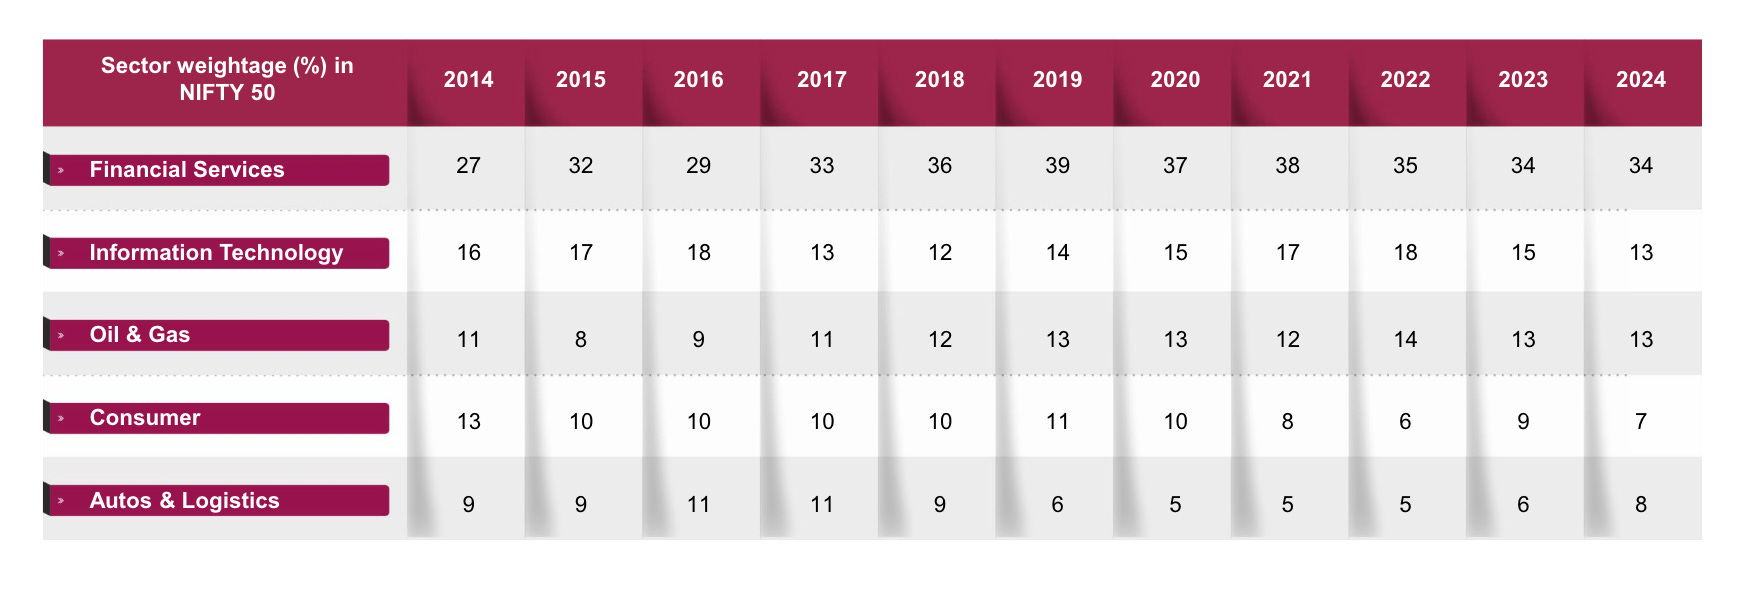
Trend of Sector Weightage in Nifty 50
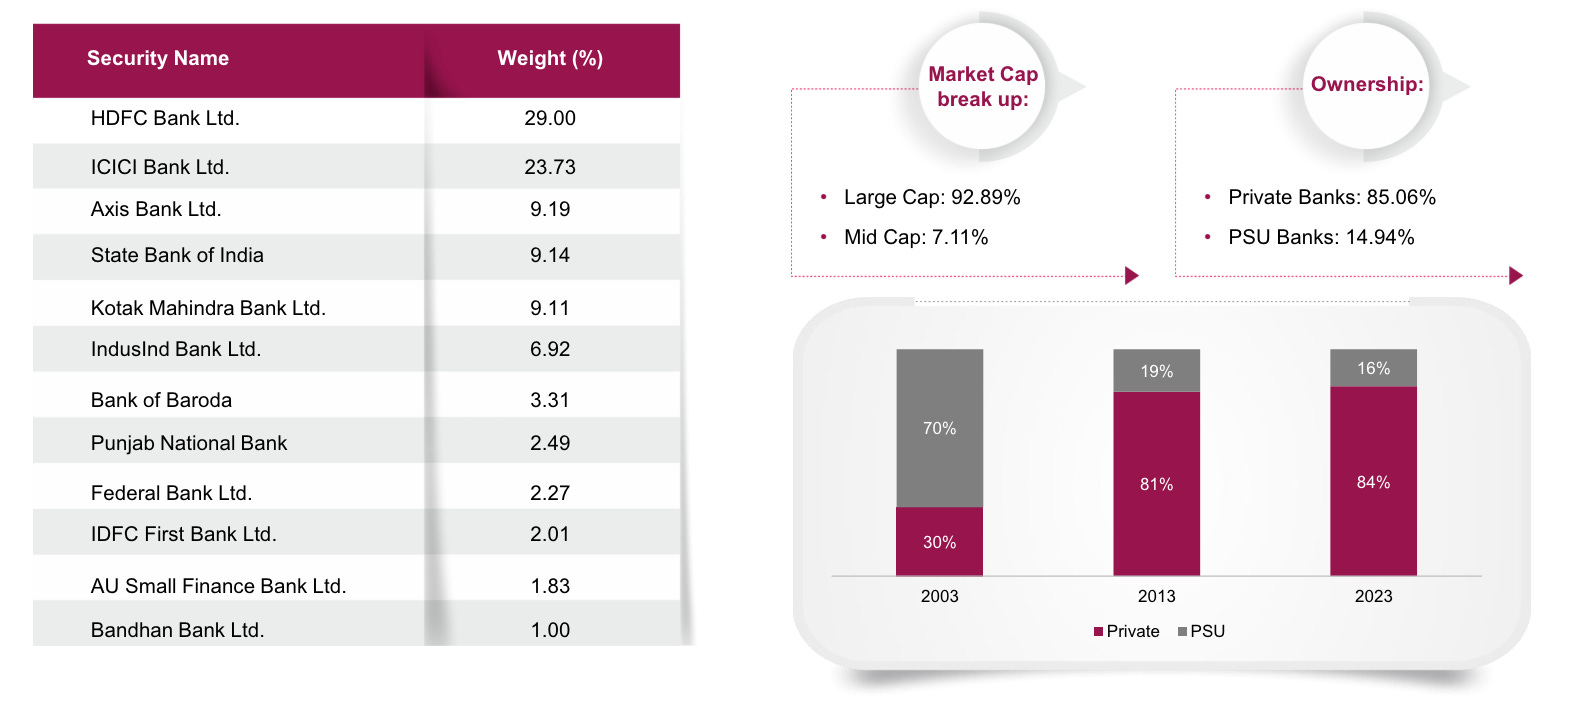
Constituents of Nifty Bank

Fundamentals of Nifty Bank

Under-penetration of credit provides long term growth opportunity
By leveraging advancements in technology, tapping into underserved markets, and capitalizing on favorable economic and regulatory conditions, banks can significantly expand their credit portfolios. This not only drives the growth of the banking sector but also contributes to the broader economic development of the country. As financial inclusion continues to progress, banks are well-positioned to play a pivotal role in facilitating access to credit and fostering long-term economic growth.
The three charts below explain that there is under-penetration of credit while comparing it to other economies of the world :
Household Debt to GDP: The chart shows India is still much behind ]in household debt to GDP ratio while compared to other similar economies, indicating that household borrowing shall be on the rise. This would mean growing consumer confidence and willingness to take on debt for consumption and investment purposes.
Corporate Debt to GDP: Similarly, in India the corporate debt to GDP ratio is low while compared to other similar economies. This suggests that there is room for businesses to borrow more to fund expansion and operations, which can be an indicator of economic growth and business confidence in the market.
Mortgage as a Percentage of Nominal GDP: The data highlights India has least mortgage as a percentage of nominal GDP. This reflects that there is whitespace for home ownership and the growing mortgage market, which is supported by favorable lending rates and government incentives for home buyers while other economies have already higher shares.

Source: BIS, Axis MF Research, Jefferies, Data as on Q3 2023
The extended period of underperformance might present a buying opportunity for value investors expecting a turnaround, given historical precedents of recovery after such stretches.

Why does it looks good on growth trajectory ?
Valuations
NPA Levels
Growth supported by balance sheet strength
Healthy Credit Demand
Lets deep dive on each point.
1- Reasonable valuations
When considering an investment in the Nifty Bank Index, understanding its current valuation metrics compared to historical averages provides valuable insights. As of now, the Nifty Bank Index has a Price-to-Book (P/B) ratio of 2.9 and a Price-to-Earnings (P/E) ratio of 15. Analyzing these figures relative to their long-term averages reveals that the index is reasonably valued, presenting a potentially attractive investment opportunity.
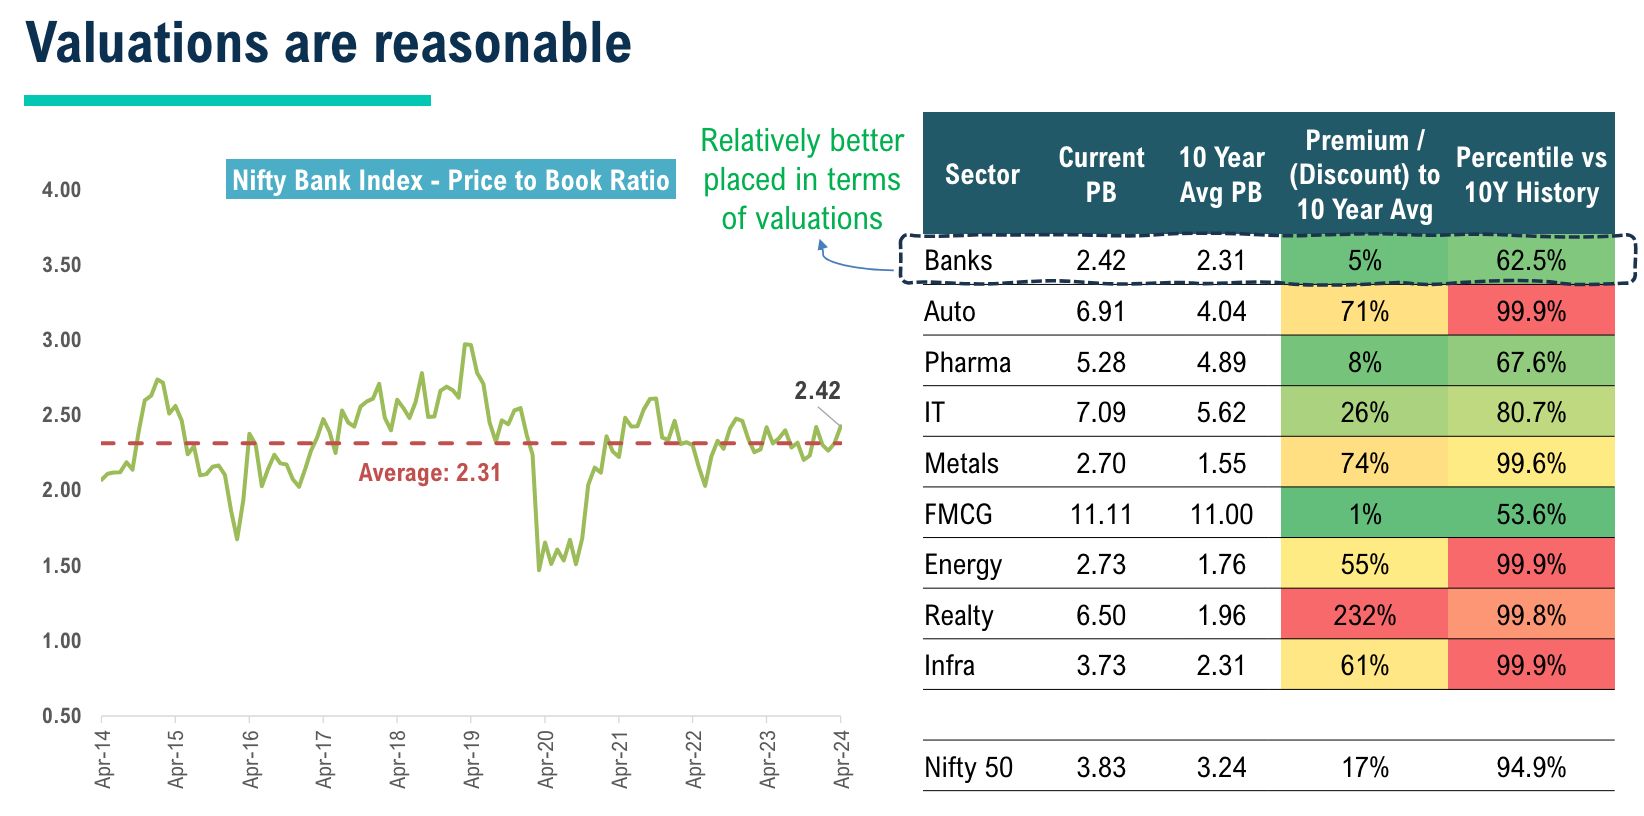
Source – Bloomberg. Data as on 30-Apr-2024. P/B – Price to Book Ratio. The Sectors are represented by following indices: Banks - Nifty Bank, Auto - Nifty Auto, Pharma - Nifty Pharma, IT - Nifty IT, Metals - Nifty Metal, FMCG - Nifty FMCG, Energy - Nifty Energy, Realty - Nifty Realty, Infra - Nifty Infrastructure. The sector(s)/stock(s)/issuer(s) mentioned in this document do not constitute any recommendation of the same and the Fund may or may not have any future position in these sector(s)/stock(s)/issuer(s).
Historic Valuations - NIFTY BANK
The reasonable valuations of the Nifty Bank Index, characterized by a P/B ratio slightly above and a P/E ratio well below long-term averages, suggest that the index is not overvalued. Investors might find this an opportune moment to invest, as the banking sector appears to offer value relative to its historical performance and future growth potential.

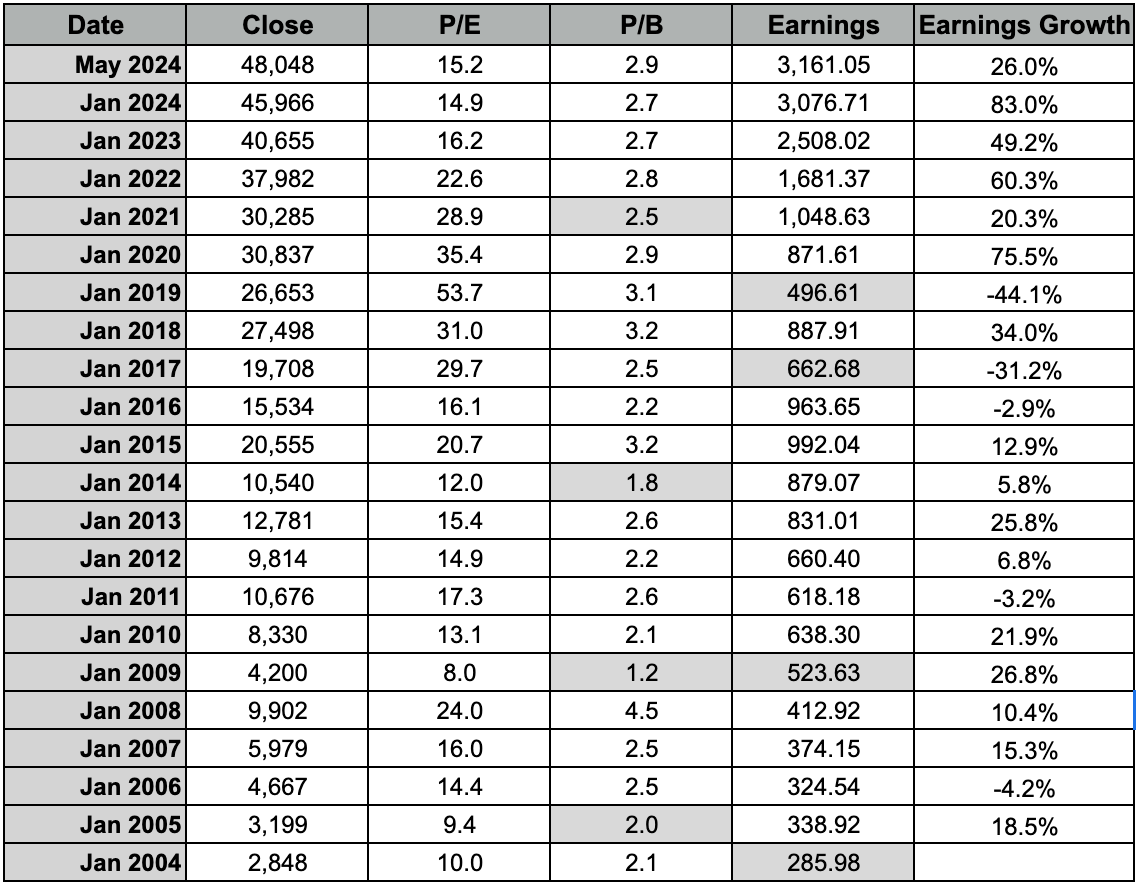
20 year Valuations
Valuation comparison with other sectors

2- Lowest NPA levels
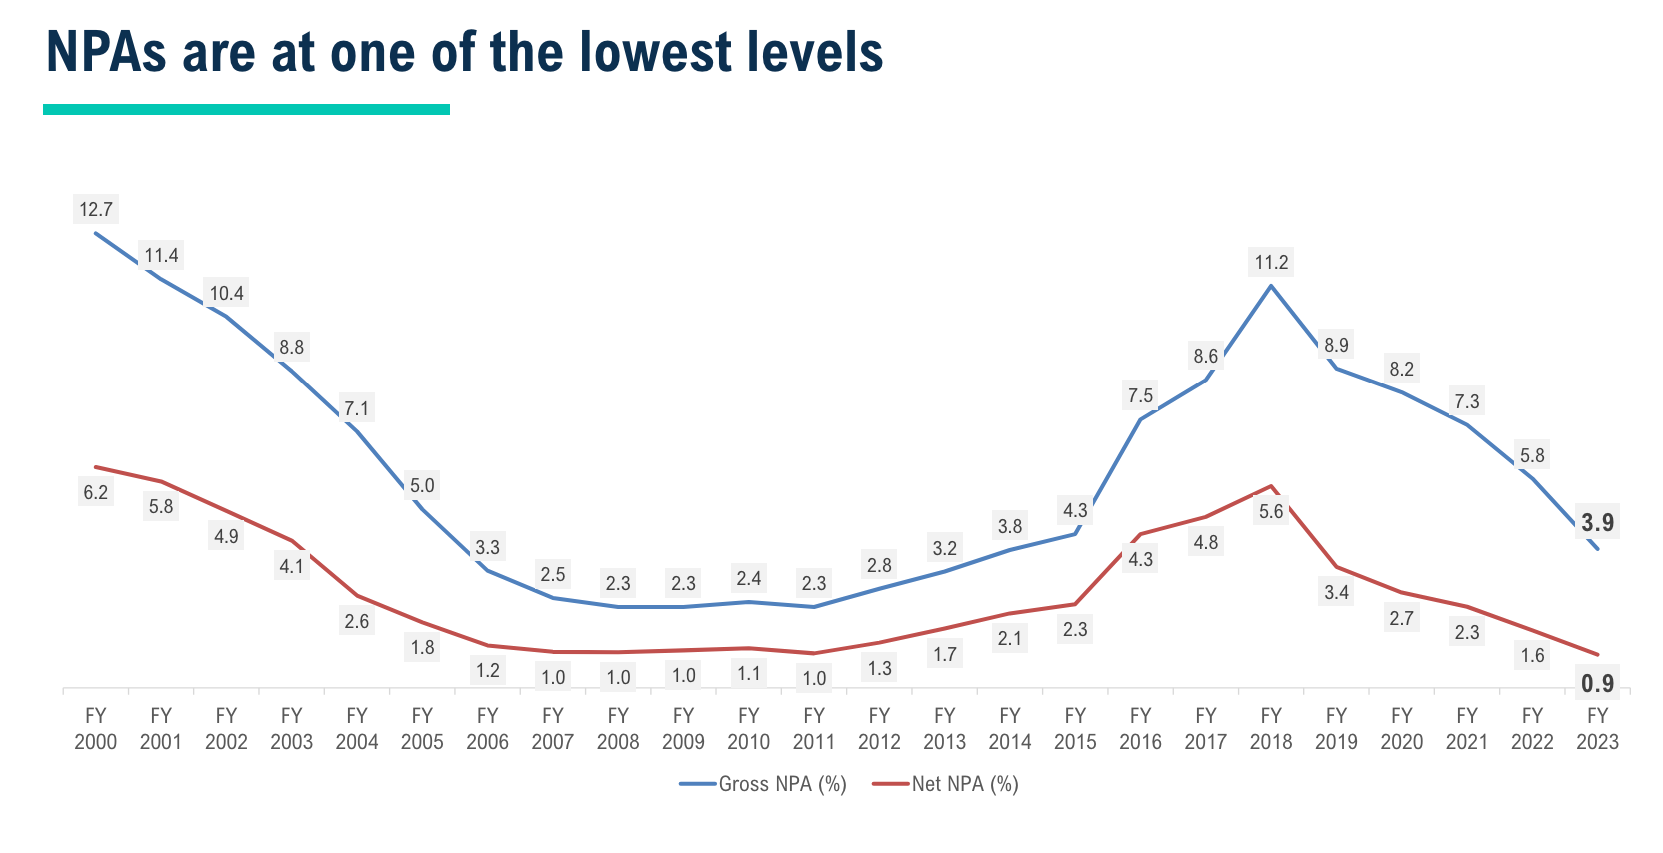
Source: RBI. Data as on 31-Mar-2023
3- Strong Balance Sheet
The improving return ratios, both ROE and ROA, of the banks within the Nifty Bank Index are a strong indicator of their financial health and operational efficiency. As banks continue to capitalize on digital advancements, economic growth, regulatory support, and financial inclusion efforts, they are well-positioned to sustain and further enhance these return ratios. This improvement not only underscores the resilience and profitability of the banking sector but also makes the Nifty Bank Index an attractive investment avenue for those looking to benefit from the long-term growth prospects of India's banking industry.

Source – Bloomberg. Data as on 30-Apr-2024. Return on Asset and Return on Equity data shown above are trailing 3-month average data of Nifty Bank Index
Banks are well capitalized with Capital Ratios significantly higher than historic levels
Despite multiple headwinds like Covid, IL&FS default, etc. asset quality of Indian banks has remained resilient across cycles
Proactive systemic controls by the regulator has helped to keep a tab on the asset quality of the banks

Source – CMIE, RBI, Internal. Data as on 31-Dec-2023 for Growth numbers and as on 30-Sep-2023 for Capital Adequacy Ratio. Credit Growth considers Non- Food Credit. Deposit Growth considers Demand and Time deposits
4 - Healthy Credit Demand
CD ratio may be a concern for a while. However, credit growth continues to be broad based and healthy
Retail credit growth to be aided by rising disposable income, increasing consumerism and easier access to credit
With healthy corporate balance sheets and higher capacity utilization, robust private capex sanctions momentum may continue

**Credit growth and deposit growth is adjusted for HDFC Bank merger
In the last 3 years, banks witnessed strong improvement in NIMs led by higher rates and mix shift towards higher margin loans
As the rate cut cycle starts, NIMs may compress as the repo-linked portfolios of the banks reprice instantaneously, while the cost of deposits moderates with a lag

Now lets move on to the performances of nifty bank !
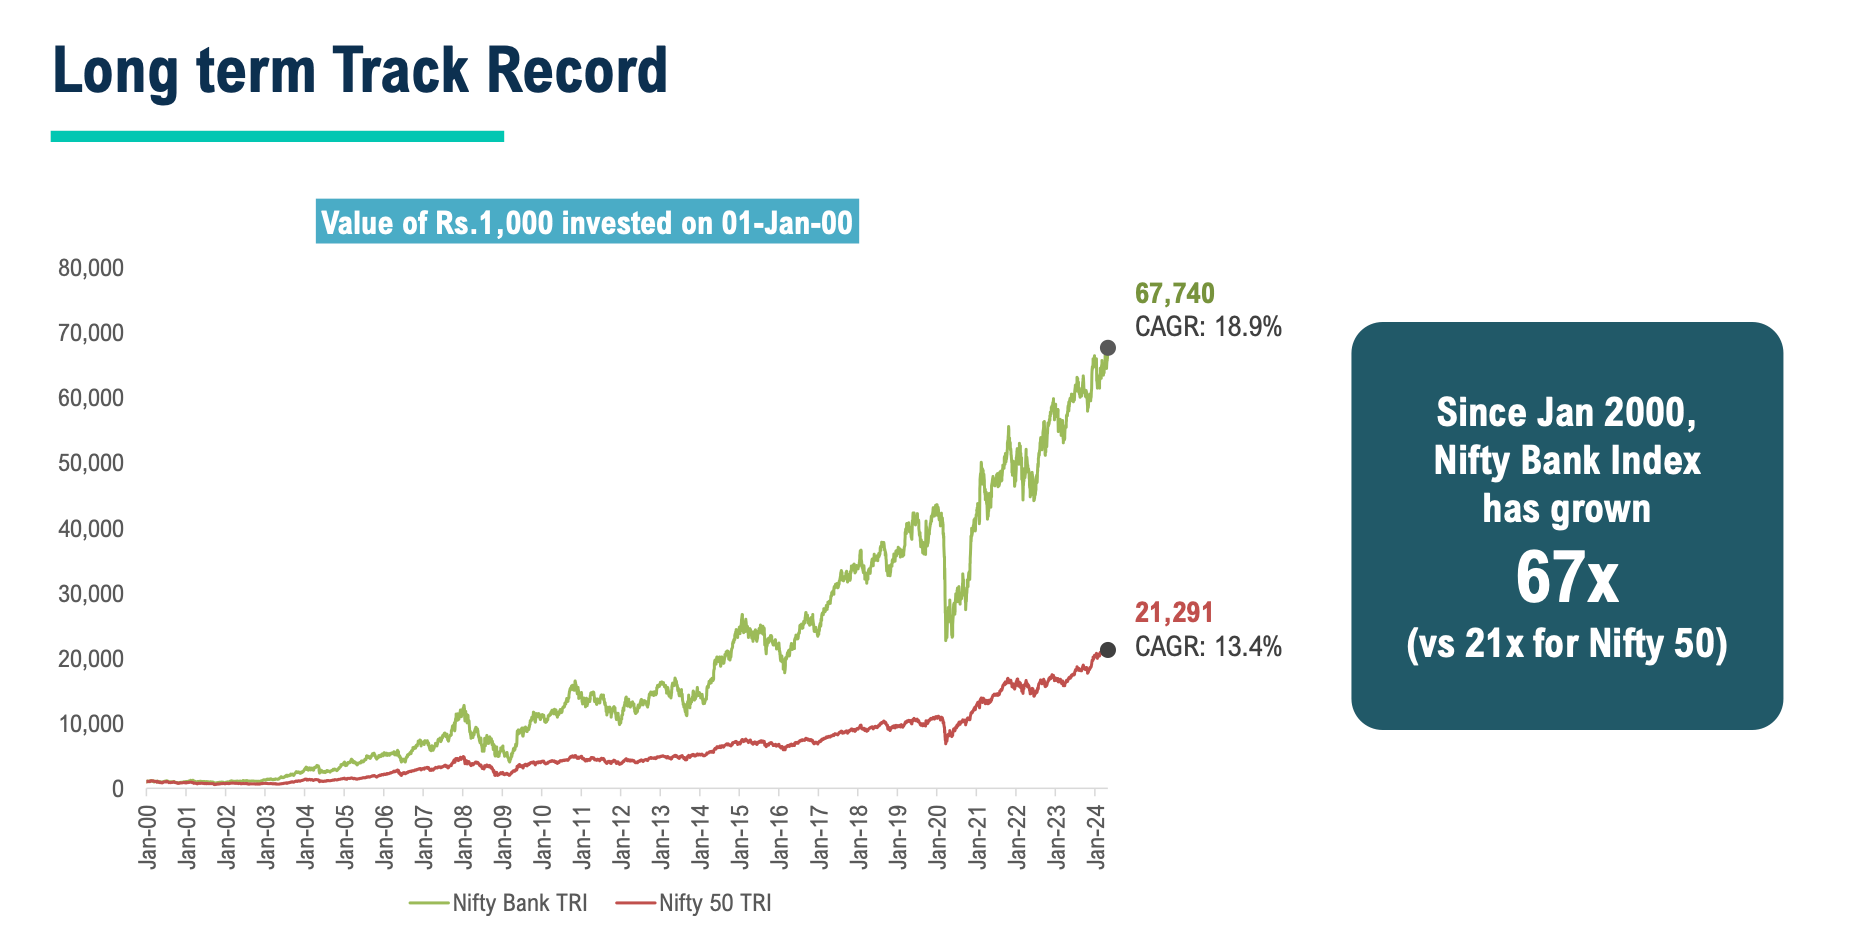
Past Performance vs Nifty 50
The Nifty Bank Index has historically outperformed the Nifty 50 over the long term. For instance, since January 2000, the Nifty Bank Index has grown 67 times compared to the Nifty 50's 21 times, showcasing its robust performance in the banking sector.
Outperformed Nifty 50 in 6 out of last 10 calendar years

The below chart demonstrates that the Nifty Bank TRI has not only provided higher median returns over various rolling periods compared to the Nifty 50 TRI but also has a significantly higher probability of achieving returns greater than 12%. This indicates the superior performance and consistency of the Nifty Bank TRI in comparison to the Nifty 50 TRI over the long term.
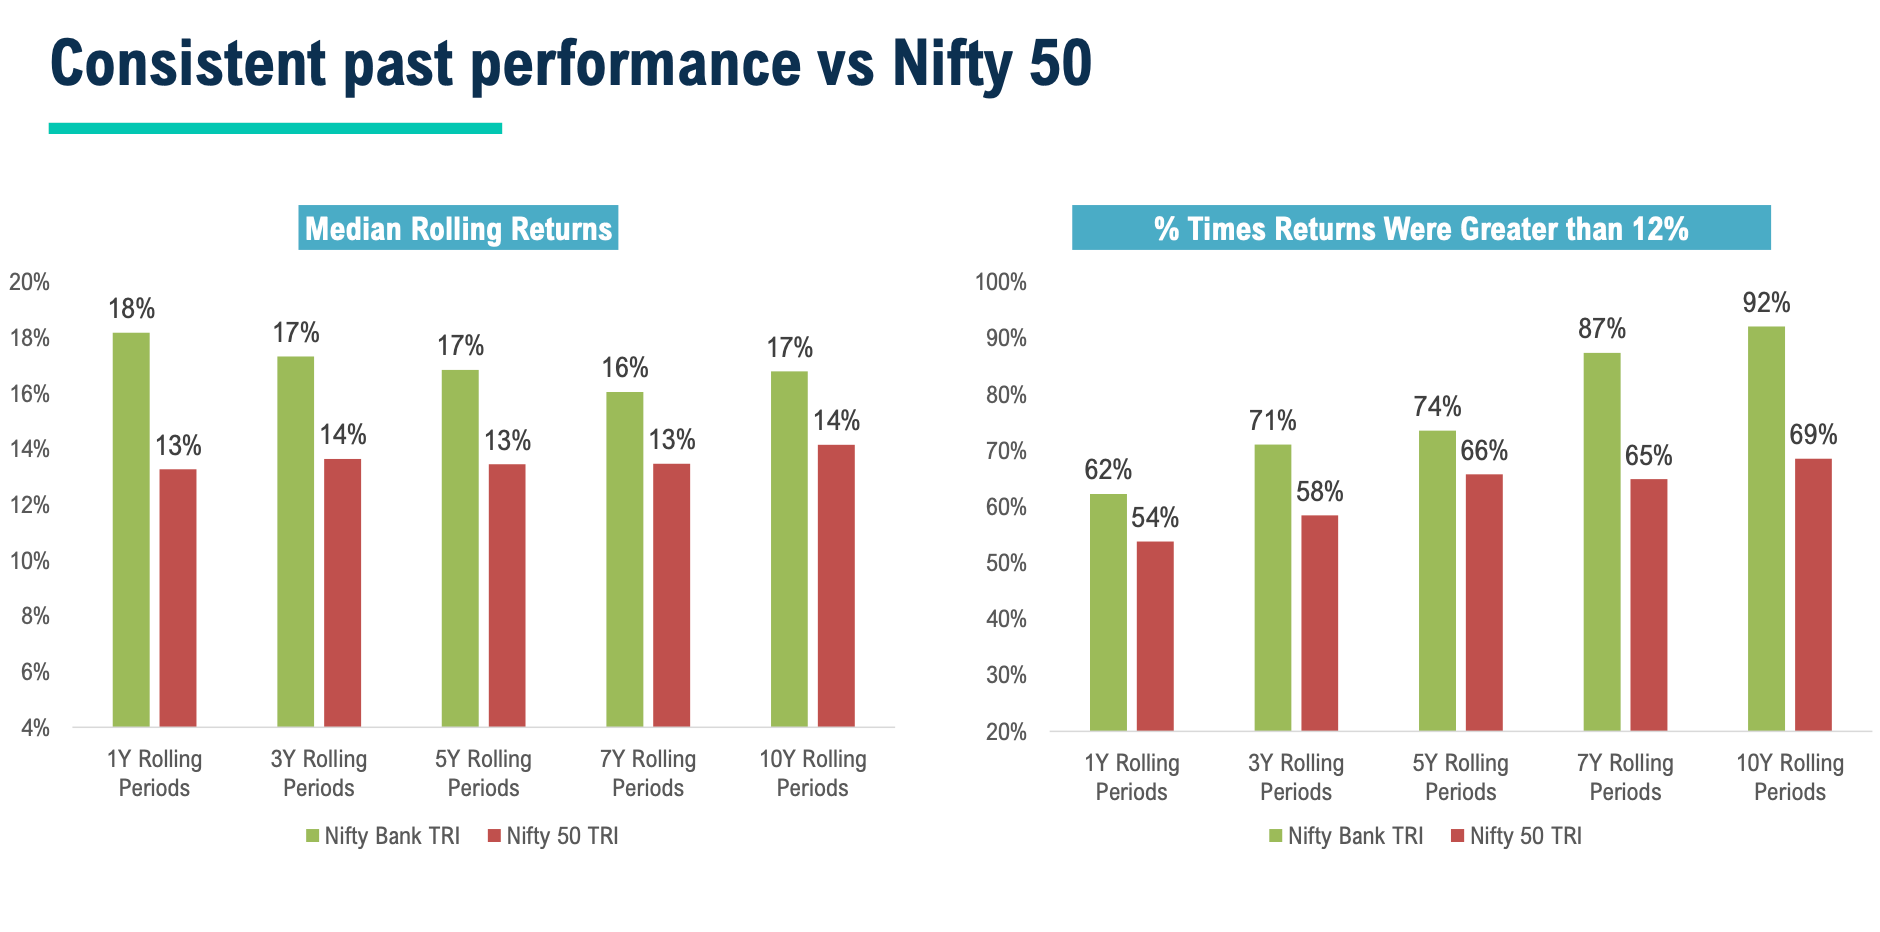
NIFTY Bank Index – Rolling Returns
Consistent Outperformance:
The Nifty Bank Index consistently outperforms the Nifty 50 across all the time horizons presented. This consistent outperformance underscores the strength and growth potential of the banking sector in India.
Higher Returns:
The significant margins by which the Nifty Bank Index outperforms the Nifty 50 indicate that investing in the banking sector can yield higher returns over the long term. This is particularly evident in the 7 & 10-year period where the outperformance is almost guaranteed (90% & 98% of the time).
Investment Horizon:
The data suggests that a longer investment horizon increases the likelihood of achieving higher returns when investing in the Nifty Bank Index compared to the Nifty 50. For investors with a long-term perspective, the Nifty Bank Index appears to be a more lucrative option.

Coming to the final segment …
RISKS
Investing in the Nifty Bank Index, like any investment, comes with risks. These include sector concentration risk, higher volatility compared to diversified equity funds, and potential short-term underperformance.
Concentration Risk
This index provides exposure only to the Banking sector, leading to sector-level concentration risk
This index has only 12 stocks, thereby leading to stock level concentration risk
High Volatility
• This fund can have higher volatility as compared to diversified equity funds
Underperformance
• This fund can underperform diversified equity funds in the short term
Possible headwinds...
In the last five years, only two stocks* part of Nifty Bank Index outperformed Nifty 50 - a broad-based reversal may take a longer time
End of rate hike cycle may pressure Net Interest Margins – can affect profitability in the short term
Tightness in liquidity and deposit mobilization – may lead to reprioritization of loan types
As we navigate the evolving landscape of financial markets, the Nifty Bank Index stands out as a compelling investment avenue, particularly through passive strategies like index funds or the etf’s. The consistent historical outperformance of the Nifty Bank Index relative to broader indices such as the Nifty 50 underscores its potential for robust returns.
Despite recent underperformance, current valuations appear reasonable, and the sector's fundamental strengths, including low NPA levels, strong balance sheets, and healthy credit demand, suggest a promising growth trajectory. The under-penetration of credit further highlights the long-term growth opportunities within the banking sector.
As passive investment strategies gain traction in India, fueled by their cost-effectiveness and transparency, now may be an opportune time for investors to consider exposure to the Nifty Bank Index. By aligning with the economic growth and leveraging the inherent strengths of India's banking sector, investors can position themselves to potentially reap significant rewards in the years to come.
Thanks for reading!
If you like found this article informative & useful, do forward it to your whatsapp groups and encourage them to subscribe. Thanks for your support!
Disclaimer: Remember, investing in etf’s, index funds, equity, mutual funds involves risks, and past performance is not indicative of future results. It's essential to conduct thorough research, consider your investment goals and risk tolerance, and consult with a financial advisor before making any investment decisions. Please note that I am not a registered financial advisor. The following information is based on personal research and is intended for informational purposes only. It is important to conduct your own research or consult with a professional financial advisor before making any investment decisions.
My Positions: Nifty Bank Bees (SIP)
Other Articles
NPS - 3 pager
Selective Spectrum - Here I share the best podcasts/videos/articles across Business, General Knowledge, Health, Productivity and many more ! Dont Miss Out !


RESOURCES:
Source: BIS, Axis MF Research, Jefferies, Data as on Q3 2023
Axis MF Research
MFI explorer, Axis MF Research
Nifty Indices, Company data, FactSet
Refinitv, Company data, Morgan Stanley Research