Hello All,
The new week is to start and here are your in-depth volume price stats on the Indian stock markets. What stories did the numbers tell us this week? Let's find out. In case you are new here, the about page for our Newsletter is here and the
last newsletter is here!
Now Lets Goooo !
How have the Sectors panned out last week?
Table toppers - Healthcare Equipment & Supplies:
Top 3 movers from ( >300cr Mcap & >3 % Weekly Change)
- Prevest Denpro - 16%
- Medplus Health Services- 9%
- Poly Medicure - 3%
Top 5 Indices this Week
Bottom 5 Indices this Week
Top 5 Indices this Month
Bottom 5 Indices this Month
Indices Performances HeatMap
How to read this ? - In 1Y, returns are max for Nifty Energy at 76.9% (Greenest) and min for Nifty Bank at 11.4% (Red). Similarly, one can check for each period.
Nifty 50
Nifty Returns over different periods
Out of 50, 45 companies gave >5% returns in last 1 year and 40 gave >5% in last 6 months.
→ 31 have beaten the Nifty 50 returns (22.2%) in last 1 year.
→ 23 out of the 50, have an alpha over Nifty50 by > 10%.
→ 13 out of these, have returns > 50%.
→ 6 out of these, have returns > 100%.
Out of 50, 13 companies gave >50% returns in last 1 year - Adani Ports, Bajaj Auto, Adani Enterprises, NTPC Ltd., Tata Motors, ONGC , L&T, Coal India, Hero Moto, Tata Consumer, BPCL, Power Grid & Sun Pharma.
→ While only 4 companies gave negative returns in last 1 year. These are UPL (-36%), HDFC BANK (-15%) & HUL (-6%) & Kotak Mahindra Bank (-3%) .
Nifty PE (Black) and Nifty Price (Pink) Chart
Nifty 50 PE Ratio
The Current PE = 22.8 and Avg PE at different time periods are :
1M = 22.5 ; 3M = 22.5 ; 6M = 22.2
1Y = 21.9 ; 2Y = 21.5 ; 5Y = 26.0
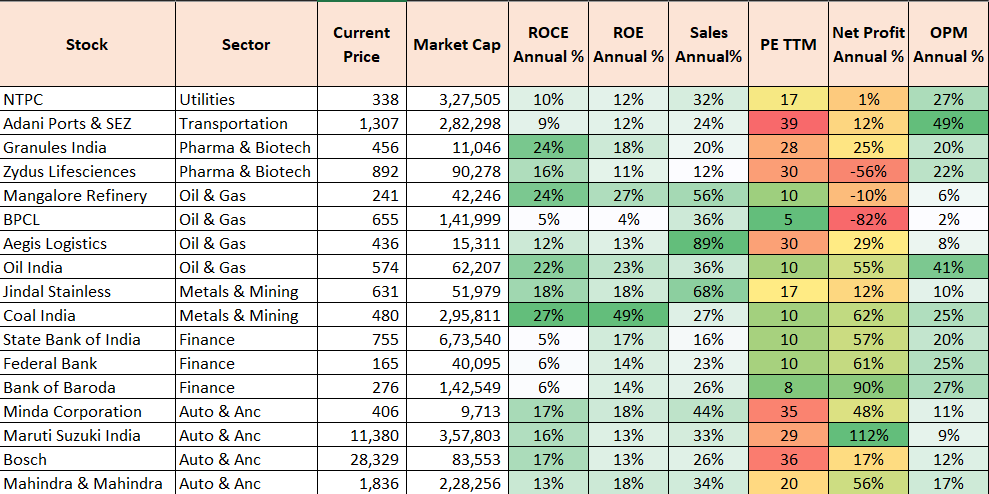
Stocks Touching 10 year high !
There can be others also which might be not part of the list but sharing here only those which have good ROCE/ROE/OPM/Revenue growth and also not overvalued.
Lot of Oil & Gas and Auto Stocks are at 10 yr high. Similar for PSU Banks. Is Pharma turning around after a dream run of 2020-21 ?
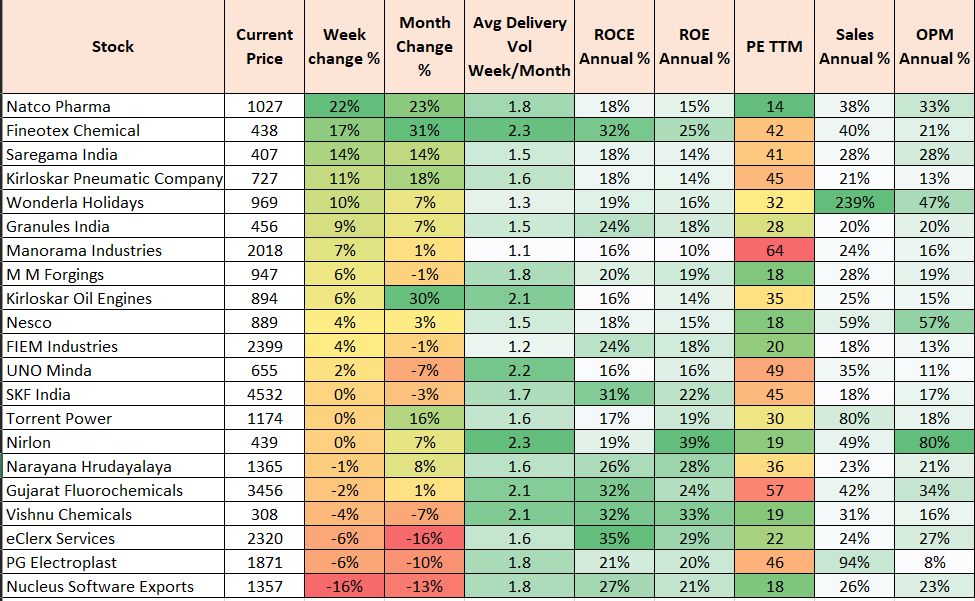
Top Weekly Gainers
Highest Volume Stocks with Good fundamentals :
These are stocks with their End of day BSE+NSE delivery volume trading 2 times of Avg Month NSE+BSE Delivery volume. Volume Multiplier is ratio of delivery of Volume at the end of the day to Average delivery volume for the Month. This indicates
- a surge in investor interest or trading activity.
- increased volatility (Opportunity for Short term).
- speculative risk.
- Improved liquidity.
It's important to note that while increased delivery volume can be a sign of significant market interest, it does not guarantee that the stock will perform well (upside/downside) in the future.
Traders and investors should consider various other factors, such as company fundamentals, market conditions, and their own investment objectives, before making decisions based solely on trading volume data. Additionally, past performance is not indicative of future results, so thorough research and risk management are essential in any strategy.
These are not recommendations to buy or sell !!
Back testing
Now, lets see the back test of this strategy over a different periods. The stock selection means that the stocks being selected are either from Nifty 50 or Nifty 500.
Tried out rebalancing of such selected stocks on a different frequencies like monthly or quarterly so that we give the stock a change to perform over such periods and then compare and then do the selection/deselection of the portfolio. Also, to compare the returns, have selected the benchmark performance as Nifty 50/500.
The above comparison gives the strategy 2 as the best strategy keeping quarterly as the best refresh and Nifty 500 as the optimum pool for stock selection. I have checked returns of Nifty 50 as well (Strategy 3) and the benchmark returns have dropped from 281% to 241%.
As per this strategy, if the rebalancing is reduced to Monthly (Strategy 1) the returns drop significantly.
If we limit the stock selection to Nifty 50 (Strategy 4), the strategy returns drop to a meagre 107% which is below par the Nifty50 CAGR.
Stocks At 52 Week High
All time high Stocks are important to track and how they have historically provided returns is shown below.
I have taken a period of 5 years to back test this and compared the returns with Nifty500 Benchmark.
Stocks with estimated High Bullishness from Analysts
Leaders with Current Price below 200Day EMA
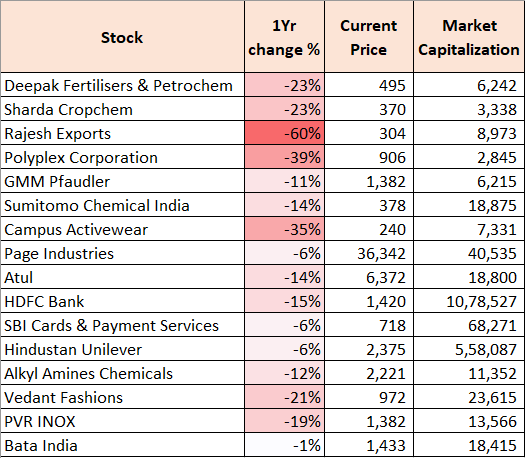
Near 52 Week Low
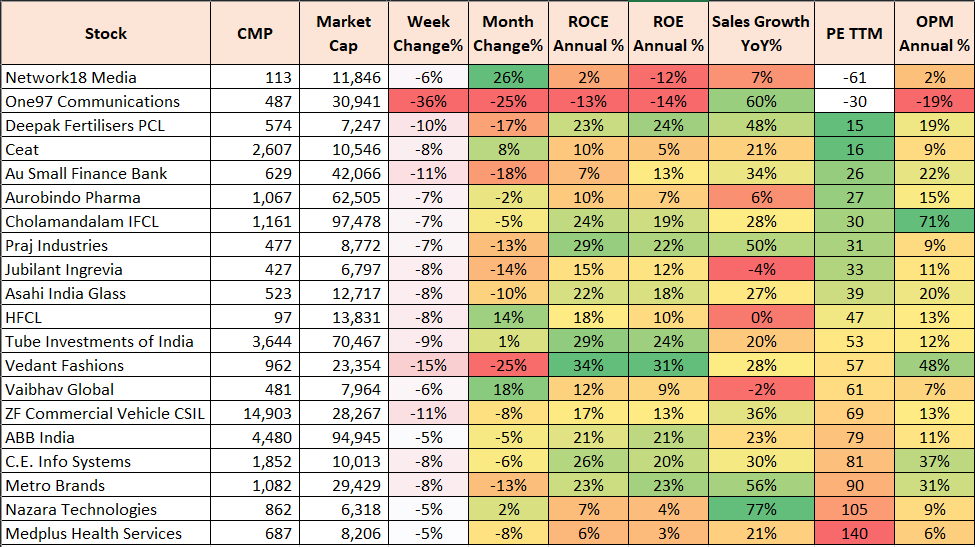
Top Weekly losers
5 Interesting Stocks
HDFC AMC
TCS
Shilchar Technologies
Sobha Ltd
Fineotex Chem
Thanks for reading till now. I hope these 5-7 mins have added some value in your analysis.
I have also written a 3 page article on NPS which you can go read through.
Click here !
Thanks,
Curious Investor


