


Month's Price Volume Action- 13th Oct'24
All the Price Volume action at one place !

Hello All,
Strong stocks have bounced back after the rapid sell-off last week. Now most of the sectoral indices are in consolidation mode. Sectors like Pharma, IT are taking the lead.
Close to a 2-week rally in the Chinese Markets now looks to lose some momentum.
Over the weekend, the Chinese Ministry of Finance held another meeting, where investors were anticipating a 2 trillion Yuan stimulus package and a stock market support fund. However, neither was announced. The absence of additional stimulus is expected to undo some of the gains in the Hang Seng, which was already under pressure heading into the weekend.
Investors can look into HangSengBees for exposure to the Chinese markets. (Not recommending to buy/sell).
Prior to this week, Indian markets saw almost selling off of nearly ₹30,000 crore in just a few days by the FIIs. This was mostly due to the Chinese stimulus provided by the Chinese central Bank where the announced these:
Lowered policy interest rates and indicated more cuts are on the way
Reduced rates on over USD 5 trillion in mortgages
Relaxed rules for second-home purchases
Lowered the required reserve ratio for banks, releasing additional liquidity
Committed over USD 100 billion in support for the equity market
The package aims to stabilize the housing market and increase money supply to spur growth.
Let's find out what stories did the other numbers tell us last month. In case you are new here, the about page for our Newsletter is here.
First lets see, where did the money come from? Both, FIIs and DIIs have been selling equities across last 4 weeks.

Nifty Smallcap100

The PE of Nifty SmallCap100 is at 36 with ~2% loss over one month. Some consolidation now can be observed as over last month, Out of 100, only 12 stocks have gained more than 5% whereas 70 gave negative returns.


How have the Sectors panned out last month ?


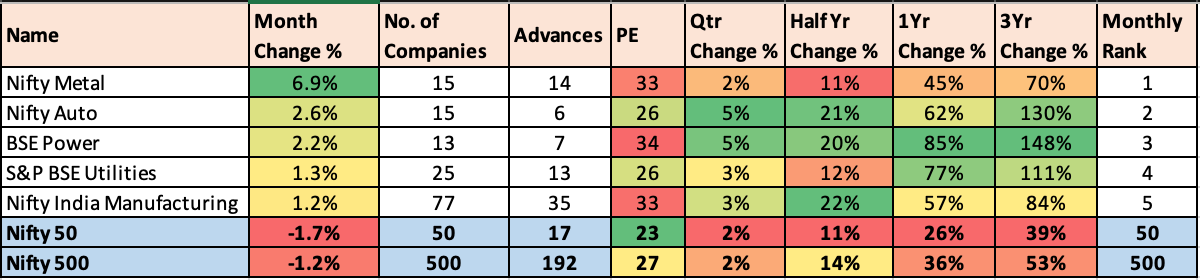


How to read this ?
For 5Y, returns are max for S&P Industrials at 440% (Greenest) and min for Nifty Media at 22% (Red). Similarly, one can check for each time period. The table is sorted by 5Y returns.


The below table includes the 4-week (4W), 20-week (20W), 30-week (30W), 40-week (40W), and 52-week (52W) moving averages. Each cell represents the percentage of total stocks in that sector, which are above the corresponding exponential moving average.


Nifty 50 Returns over last month

Out of 50, 47 stocks gave >5% returns in last 1 year and 35 gave >5% in last 6 months.
→ In last 1 year, 32 have beaten the Nifty 50 returns (26.1%).
→ Only 4 out of 50, gave >100% returns in 1 year. (Trent,Bajaj Auto, BEL & MnM).
→ While 3 gave negative returns in last 1 year. Bajaj Finance, IndusInd & Asian Paints.


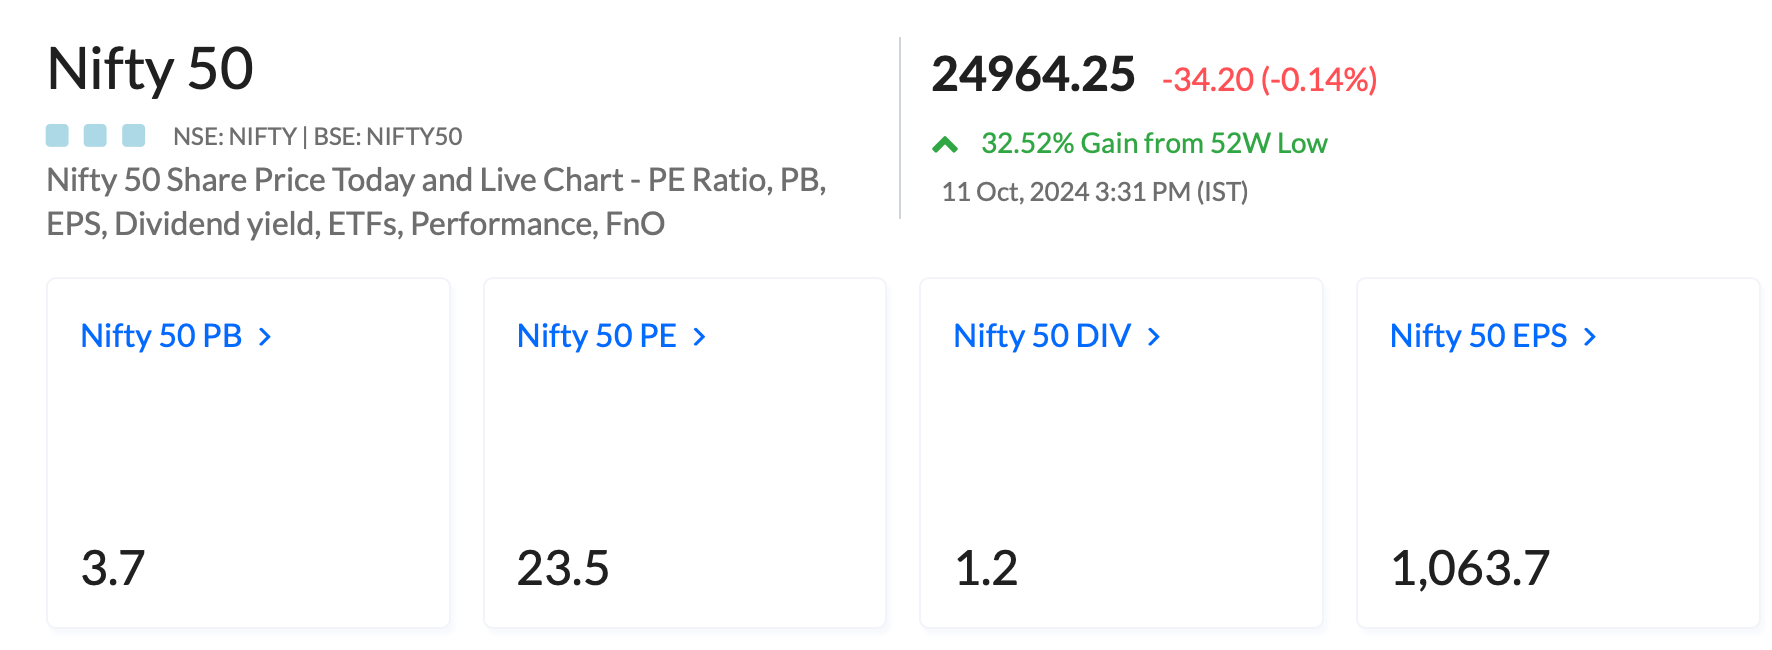
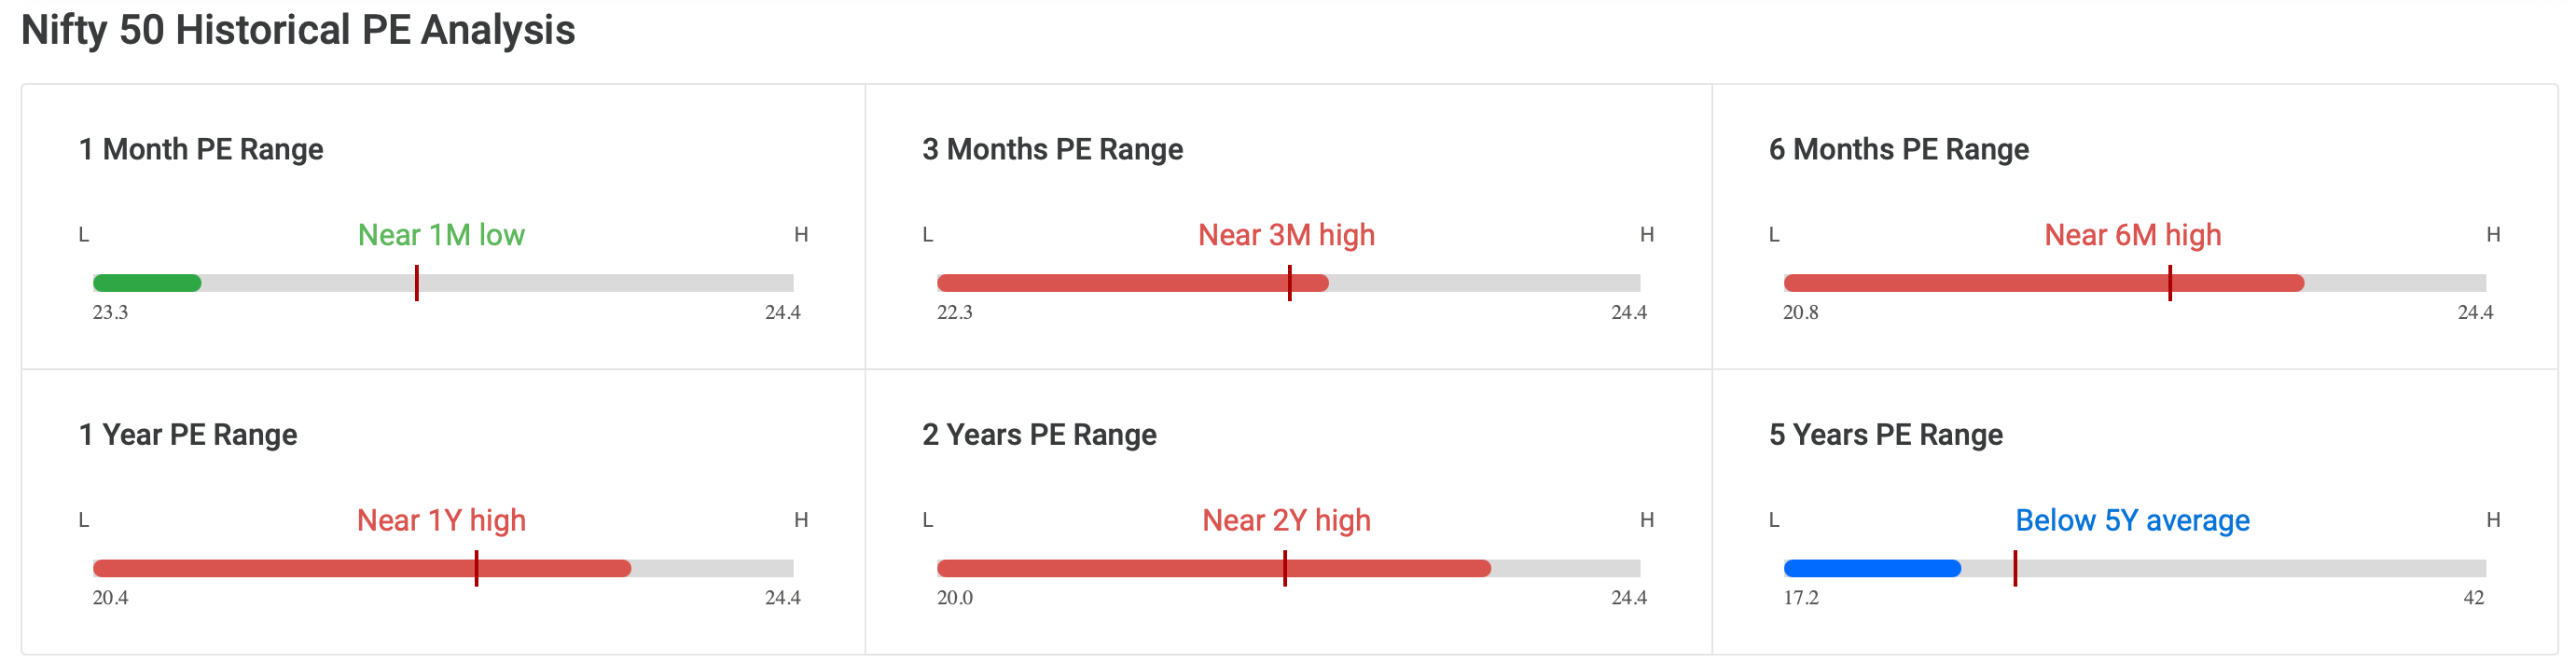
The Current PE = 23.5
Nifty 50 Historical Avg PE at different time periods are :
1M = 23.8 ; 3M = 23.34 ; 6M = 22.76
1Y = 22.6 ; 2Y = 22.1 ; 5Y = 25.3

"Stocks Touching 10-Year High" signifies that a stock has reached its highest price level in the past decade. This indicates long-term strong performance and positive market sentiment. It suggests robust business growth and investor confidence, potentially attracting more interest and indicating sustained upward momentum. However, it may also prompt caution regarding overvaluation. There can be others also which might be not part of the list but sharing here only those which have good ROCE/ROE/OPM/Revenue growth and also not overvalued.


Great momentum stocks indicating strong short-term and medium-term performance, driven by positive news, earnings reports, or market trends. Do note the valuations of the stocks!


These are stocks with their End of day BSE+NSE delivery volume trading 2 times of Avg Month NSE+BSE Delivery volume. Volume Multiplier is ratio of delivery of Volume at the end of the day to Average delivery volume for the Month. This indicates
- a surge in investor interest or trading activity.
- increased volatility (Opportunity for Short term).
- speculative risk.
- Improved liquidity.

It's important to note that while increased delivery volume can be a sign of significant market interest, it does not guarantee that the stock will perform well (upside/downside) in the future.
Traders and investors should consider various other factors, such as company fundamentals, market conditions, and their own investment objectives, before making decisions based solely on trading volume data. Additionally, past performance is not indicative of future results, so thorough research and risk management are essential in any strategy.
These are not recommendations to buy or sell !!
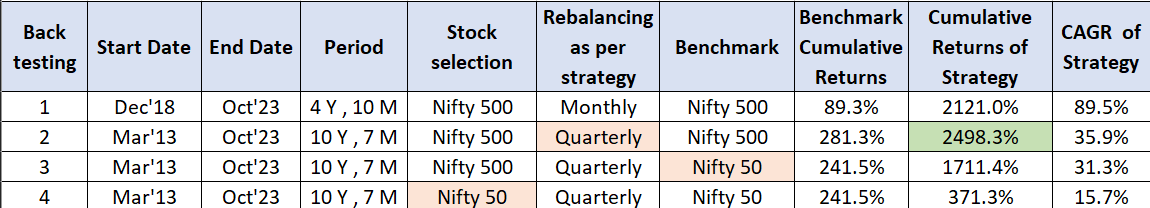
Back testing
Now, lets see the back test of this strategy over a different periods. The stock selection means that the stocks being selected are either from Nifty 50 or Nifty 500.
Tried out rebalancing of such selected stocks on a different frequencies like monthly or quarterly so that we give the stock a change to perform over such periods and then compare and then do the selection/deselection of the portfolio. Also, to compare the returns, have selected the benchmark performance as Nifty 50/500.
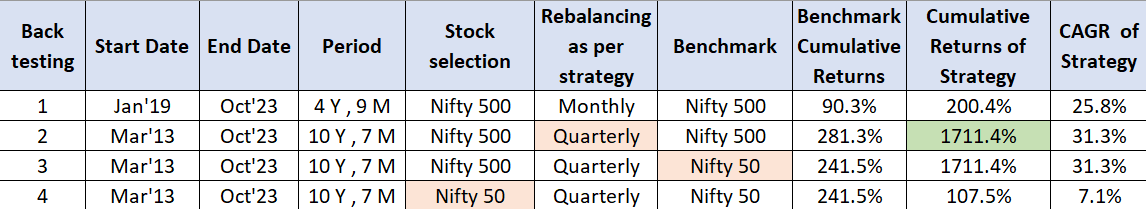
The above comparison gives the strategy 2 as the best strategy keeping quarterly as the best refresh and Nifty 500 as the optimum pool for stock selection. I have checked returns of Nifty 50 as well (Strategy 3) and the benchmark returns have dropped from 281% to 241%.
As per this strategy, if the rebalancing is reduced to Monthly (Strategy 1) the returns drop significantly.
If we limit the stock selection to Nifty 50 (Strategy 4), the strategy returns drop to a meagre 107% which is below par the Nifty50 CAGR.

Stocks at 52-Week High indicates that a stock has reached its highest price in the past year, reflecting strong performance and positive market sentiment. This milestone can signal upward momentum but may also suggest potential overvaluation. Investors often watch these stocks for further gains or reassess their strategies based on this performance indicator. For some traders, a stock hitting a 52-week high might signal a breakout, suggesting that the stock could continue to rise if it surpasses previous resistance levels.
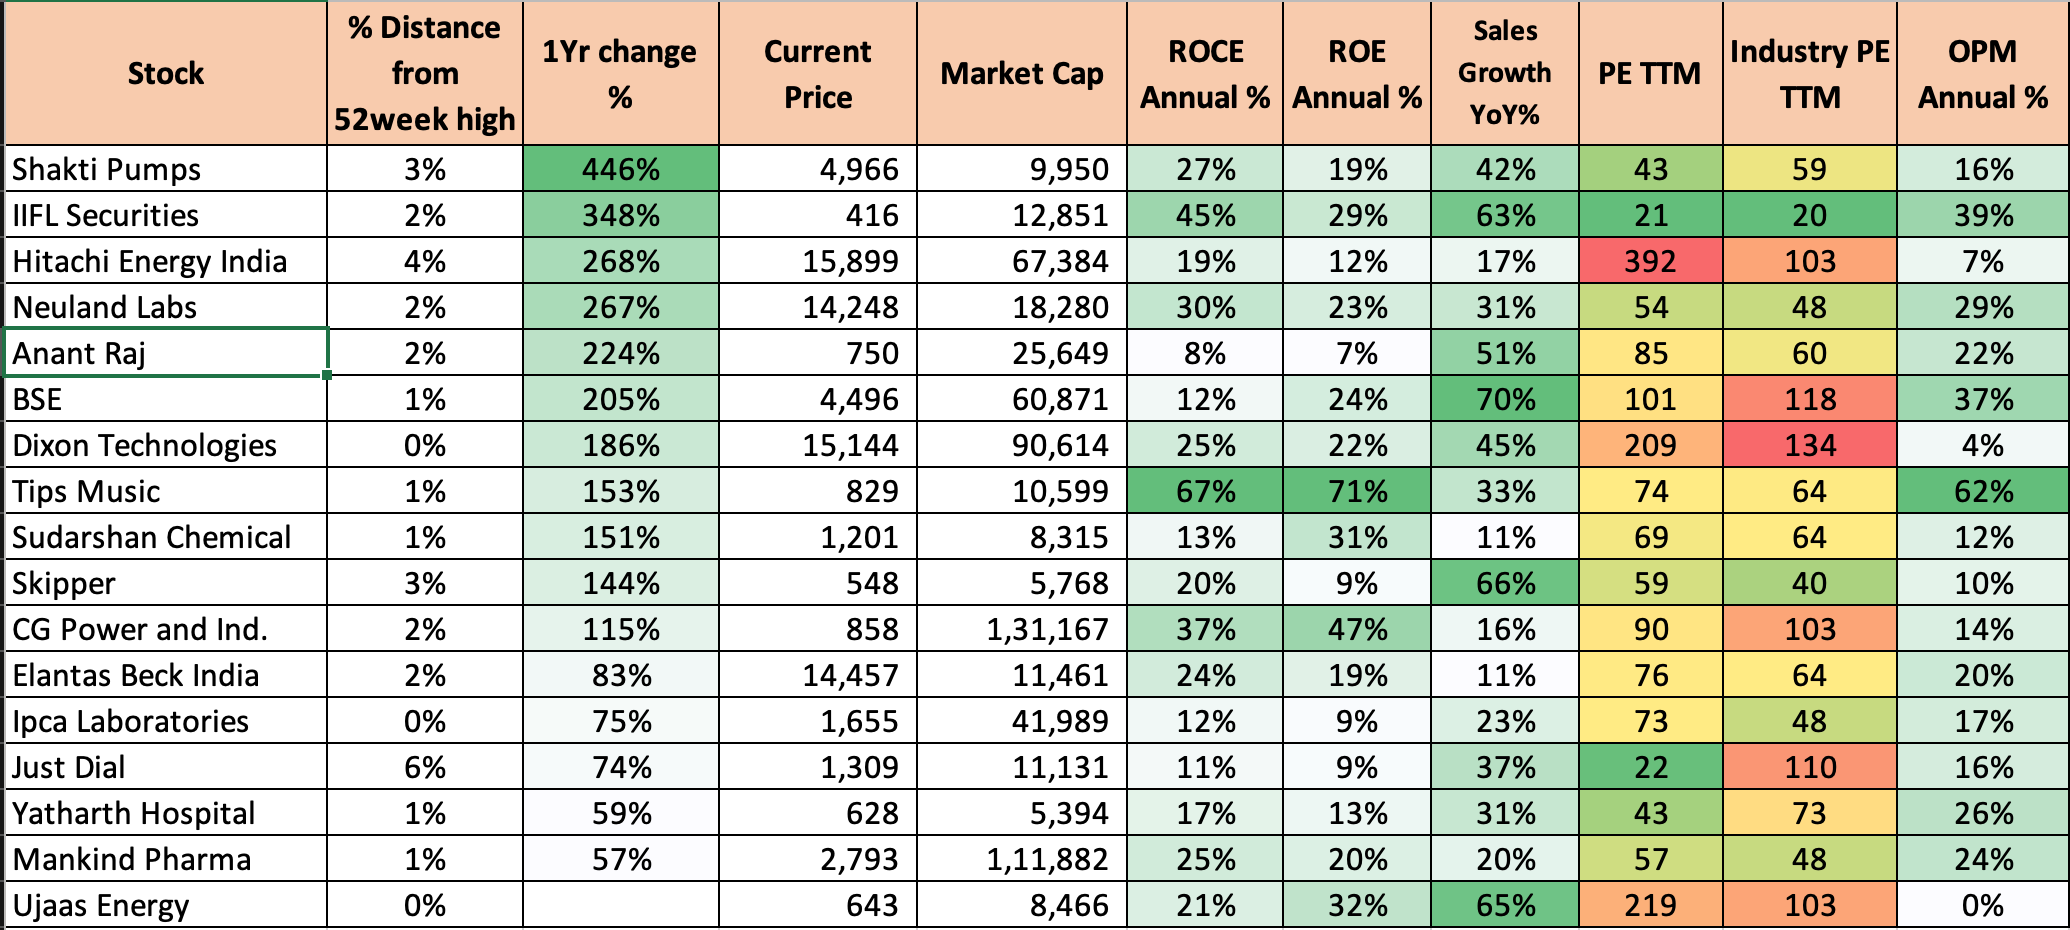
All time high Stocks are important to track and how they have historically provided returns is shown below.
I have taken a period of 5 years to back test this and compared the returns with Nifty500 Benchmark.

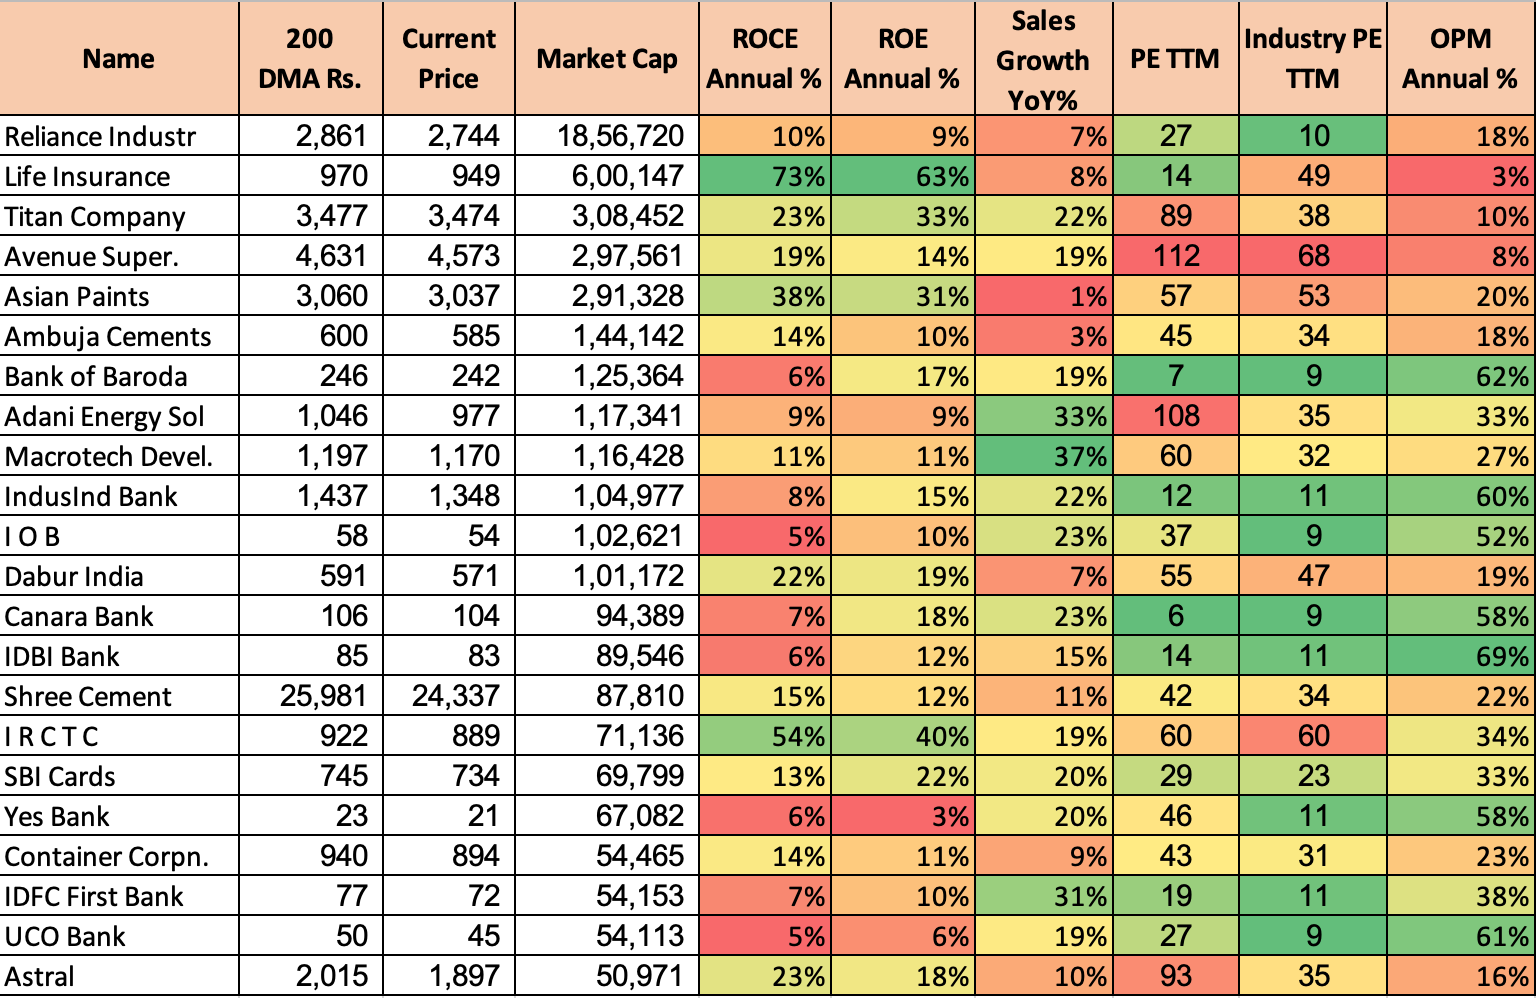
In technical analysis, the 200-day DMA is a long-term trend indicator. When the current price is below this level, it might signal a bearish trend or a downturn. While other aspect is that these leading stocks may be temporarily undervalued, presenting a potential buying opportunity for investors who believe the stock will revert to its mean or rise above the 200-day DMA again especially where the valuations are sane.


Vmart

Dynemic Products

Amrutanjan

Usha Martin

Elantas Beck

Thanks for reading till now. I hope these 5-7 mins have added some value in your analysis.
Thanks,
Curious Investor