


Month's Price Volume Action- 29th Dec'24
All the Price Volume action at one place !

Hello All,
So last 2 trading days of 2024 and we will be moving to 2025 ! The markets soared high during the start of the year but came down significantly in last one quarter. Nifty 50 gave returns of 9.3% whereas Microcap 250 gave returns of 35%.
1 lac spread across each of the below index (equi weighted) would have given one 25% returns without applying any brains. :)
Returns on Indices across time periods

Returns across Sectors in last 1 year
Pharma (36.5%) and Real Estate (36.2%) emerged as the top-performing sectors in 2024, closely followed by Microcaps (32.73%). Interestingly, returns on Gold were more than other sectors . Smallcaps (23.18%) and Midcaps (22.61%) also outperformed the Nifty, which posted a modest single-digit return of 9.6%.
On the other hand, FMCG (-1.5%) and Media (-23.7%) were the only two sectors to end the year in negative territory.

Nifty Smallcap100

The PE of Nifty SmallCap100 is at 34.7 with ~1.3% gains over one month. Some consolidation now can be observed as over last month, Out of 100, only 20 stocks have gained more than 5% whereas 51 gave negative returns.


How have the Sectors panned out last month ?


How to read this ?
For 5Y, returns are max for S&P Industrials at 440% (Greenest) and min for Nifty Media at 22% (Red). Similarly, one can check for each time period. The table is sorted by 5Y returns.


The below table includes the 4-week (4W), 20-week (20W), 30-week (30W), 40-week (40W), and 52-week (52W) moving averages. Each cell represents the percentage of total stocks in that sector, which are above the corresponding exponential moving average.


Nifty 50 Returns over last month

Out of 50, only 27 stocks gave >5% returns in last 1 year and only 14 gave >5% in last 6 months.
→ In last 1 year, 24 have beaten the Nifty 50 returns (9.3%).
→ Only 1 out of 50, gave >100% returns in 1 year. (Trent).
→ While 17 gave negative returns in last 1 year. IndusInd , Asian Paints and Nestle the top losers.


The Current PE = 21.9
Nifty 50 Historical Avg PE at different time periods are :
1M = 22.34 ; 3M = 22.64 ; 6M = 22.95
1Y = 22.73 ; 2Y = 22.21 ; 5Y = 25.05


"Stocks Touching 10-Year High" signifies that a stock has reached its highest price level in the past decade. This indicates long-term strong performance and positive market sentiment. It suggests robust business growth and investor confidence, potentially attracting more interest and indicating sustained upward momentum. However, it may also prompt caution regarding overvaluation. There can be others also which might be not part of the list but sharing here only those which have good ROCE/ROE/OPM/Revenue growth and also not overvalued.


Great momentum stocks indicating strong short-term and medium-term performance, driven by positive news, earnings reports, or market trends. Do note the valuations of the stocks!


Stocks at 52-Week High indicates that a stock has reached its highest price in the past year, reflecting strong performance and positive market sentiment. This milestone can signal upward momentum but may also suggest potential overvaluation. Investors often watch these stocks for further gains or reassess their strategies based on this performance indicator. For some traders, a stock hitting a 52-week high might signal a breakout, suggesting that the stock could continue to rise if it surpasses previous resistance levels.

52 week high Stocks are important to track and how they have historically provided returns is shown below.
I have taken a period of 5 years to back test this and compared the returns with Nifty500 Benchmark.
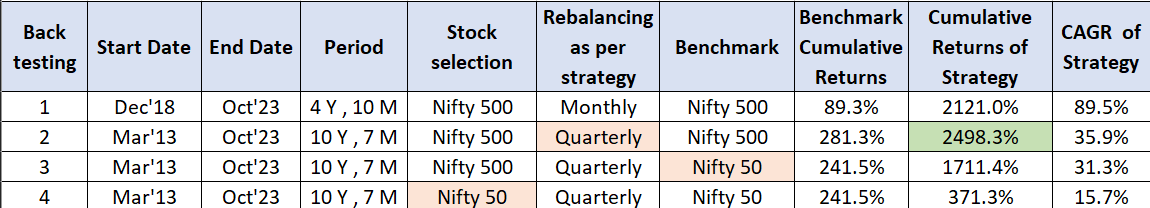

In technical analysis, the 200-day DMA is a long-term trend indicator. When the current price is below this level, it might signal a bearish trend or a downturn. While other aspect is that these leading stocks may be temporarily undervalued, presenting a potential buying opportunity for investors who believe the stock will revert to its mean or rise above the 200-day DMA again especially where the valuations are sane.


Sarla Performance Fibers

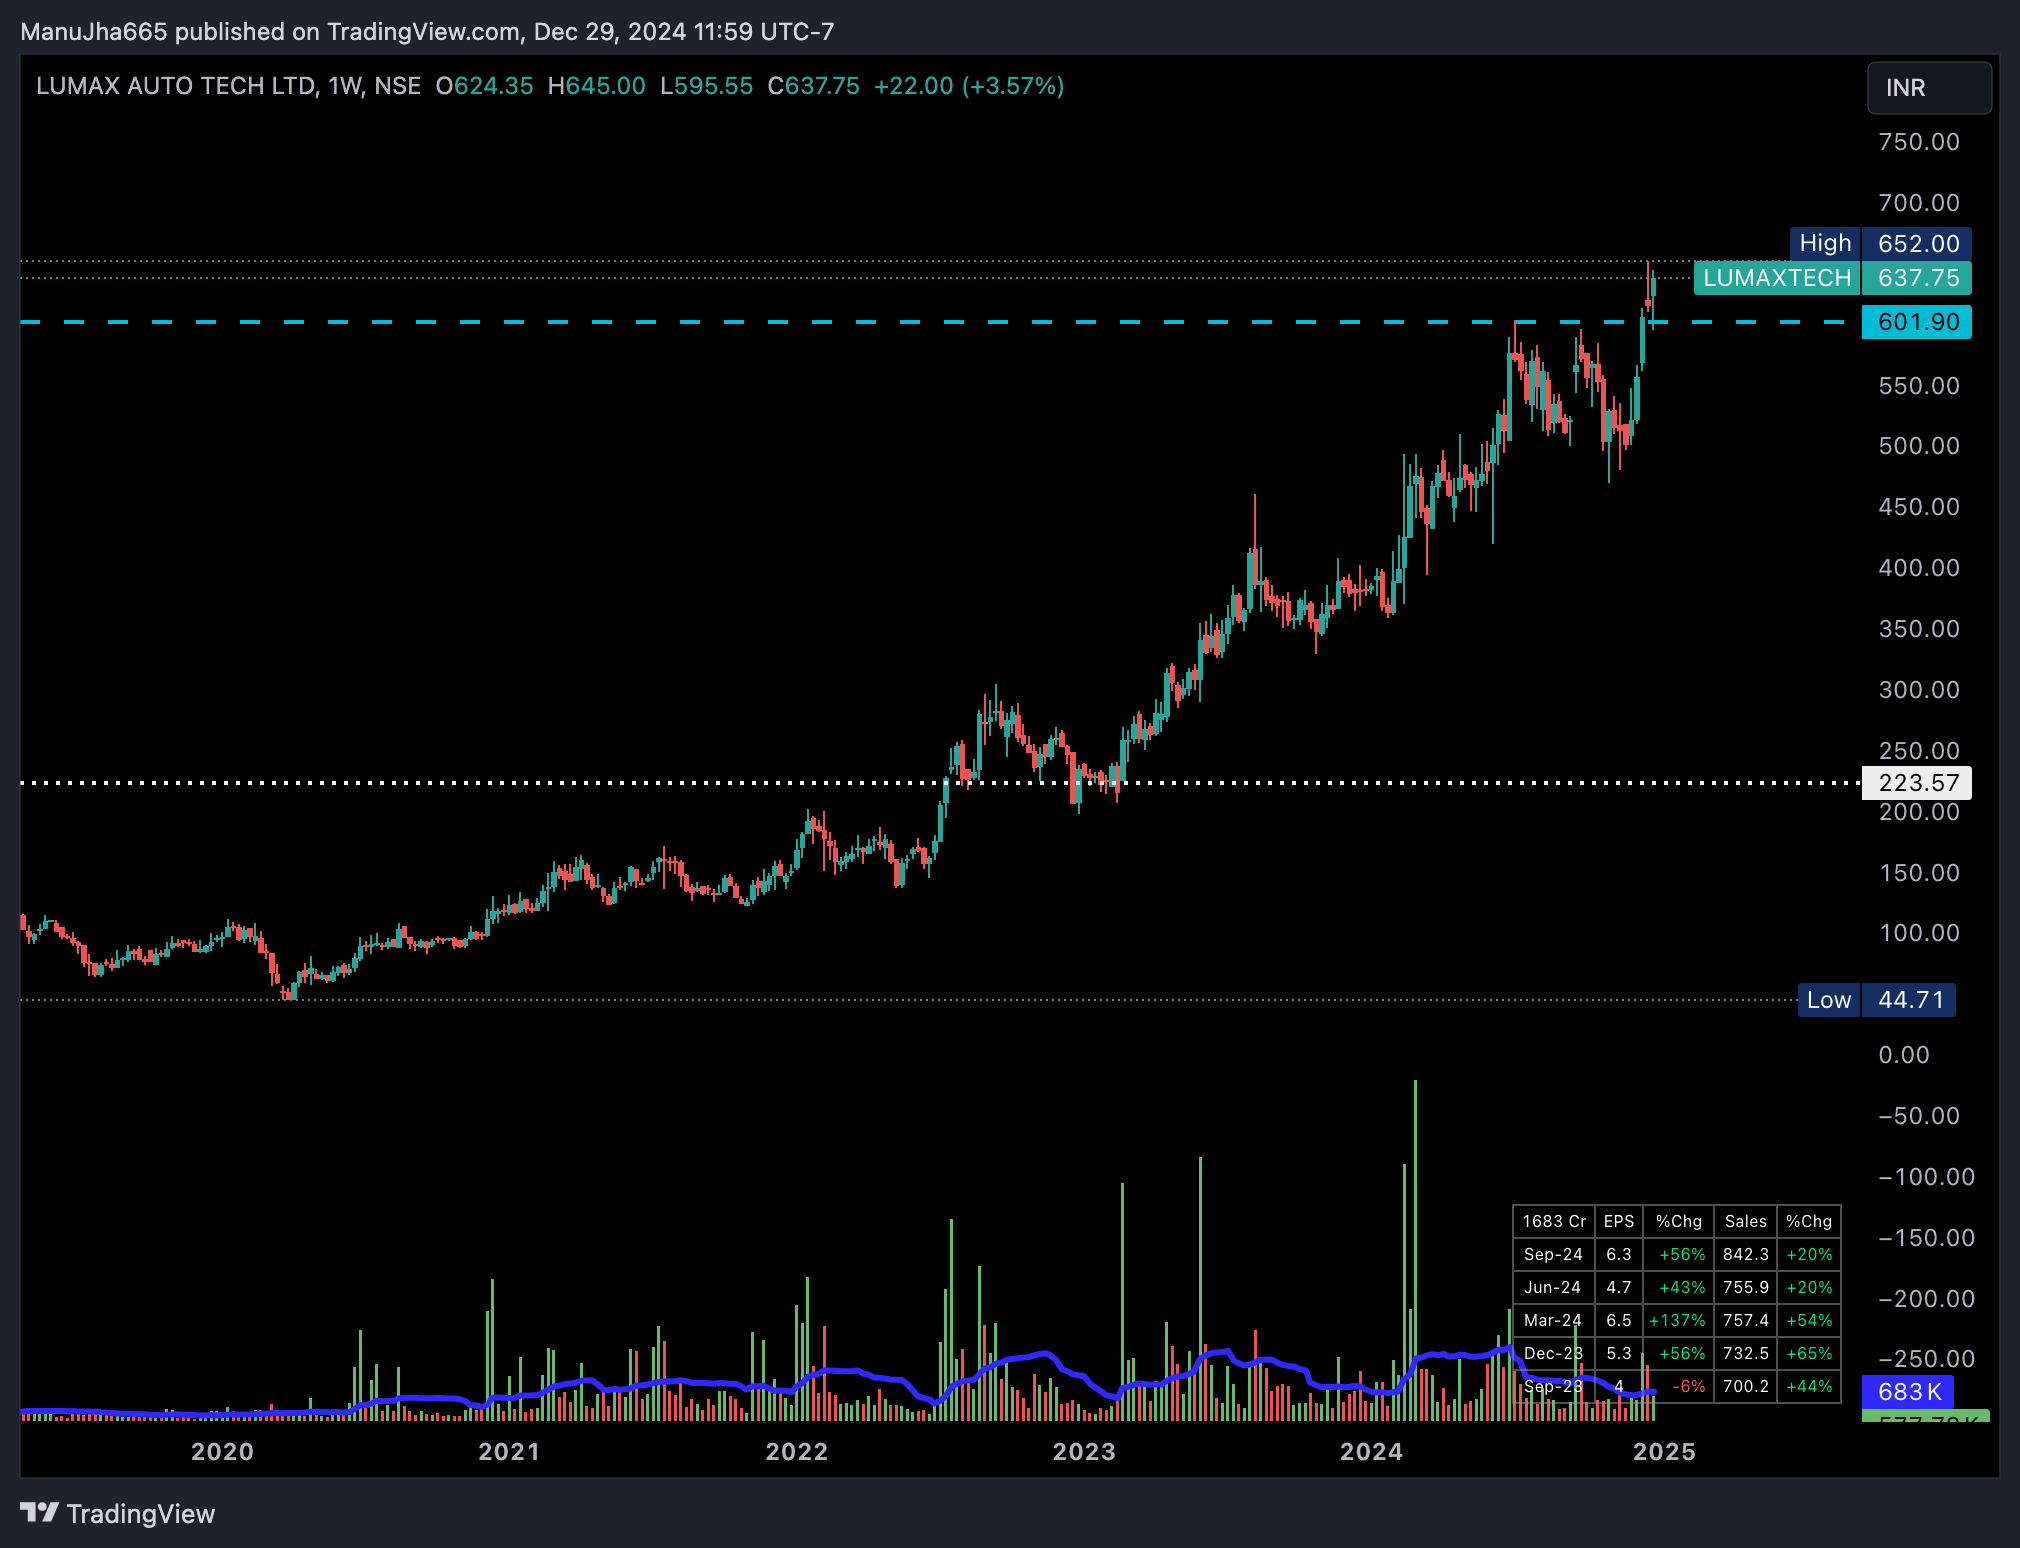
Lumax Auto Tech
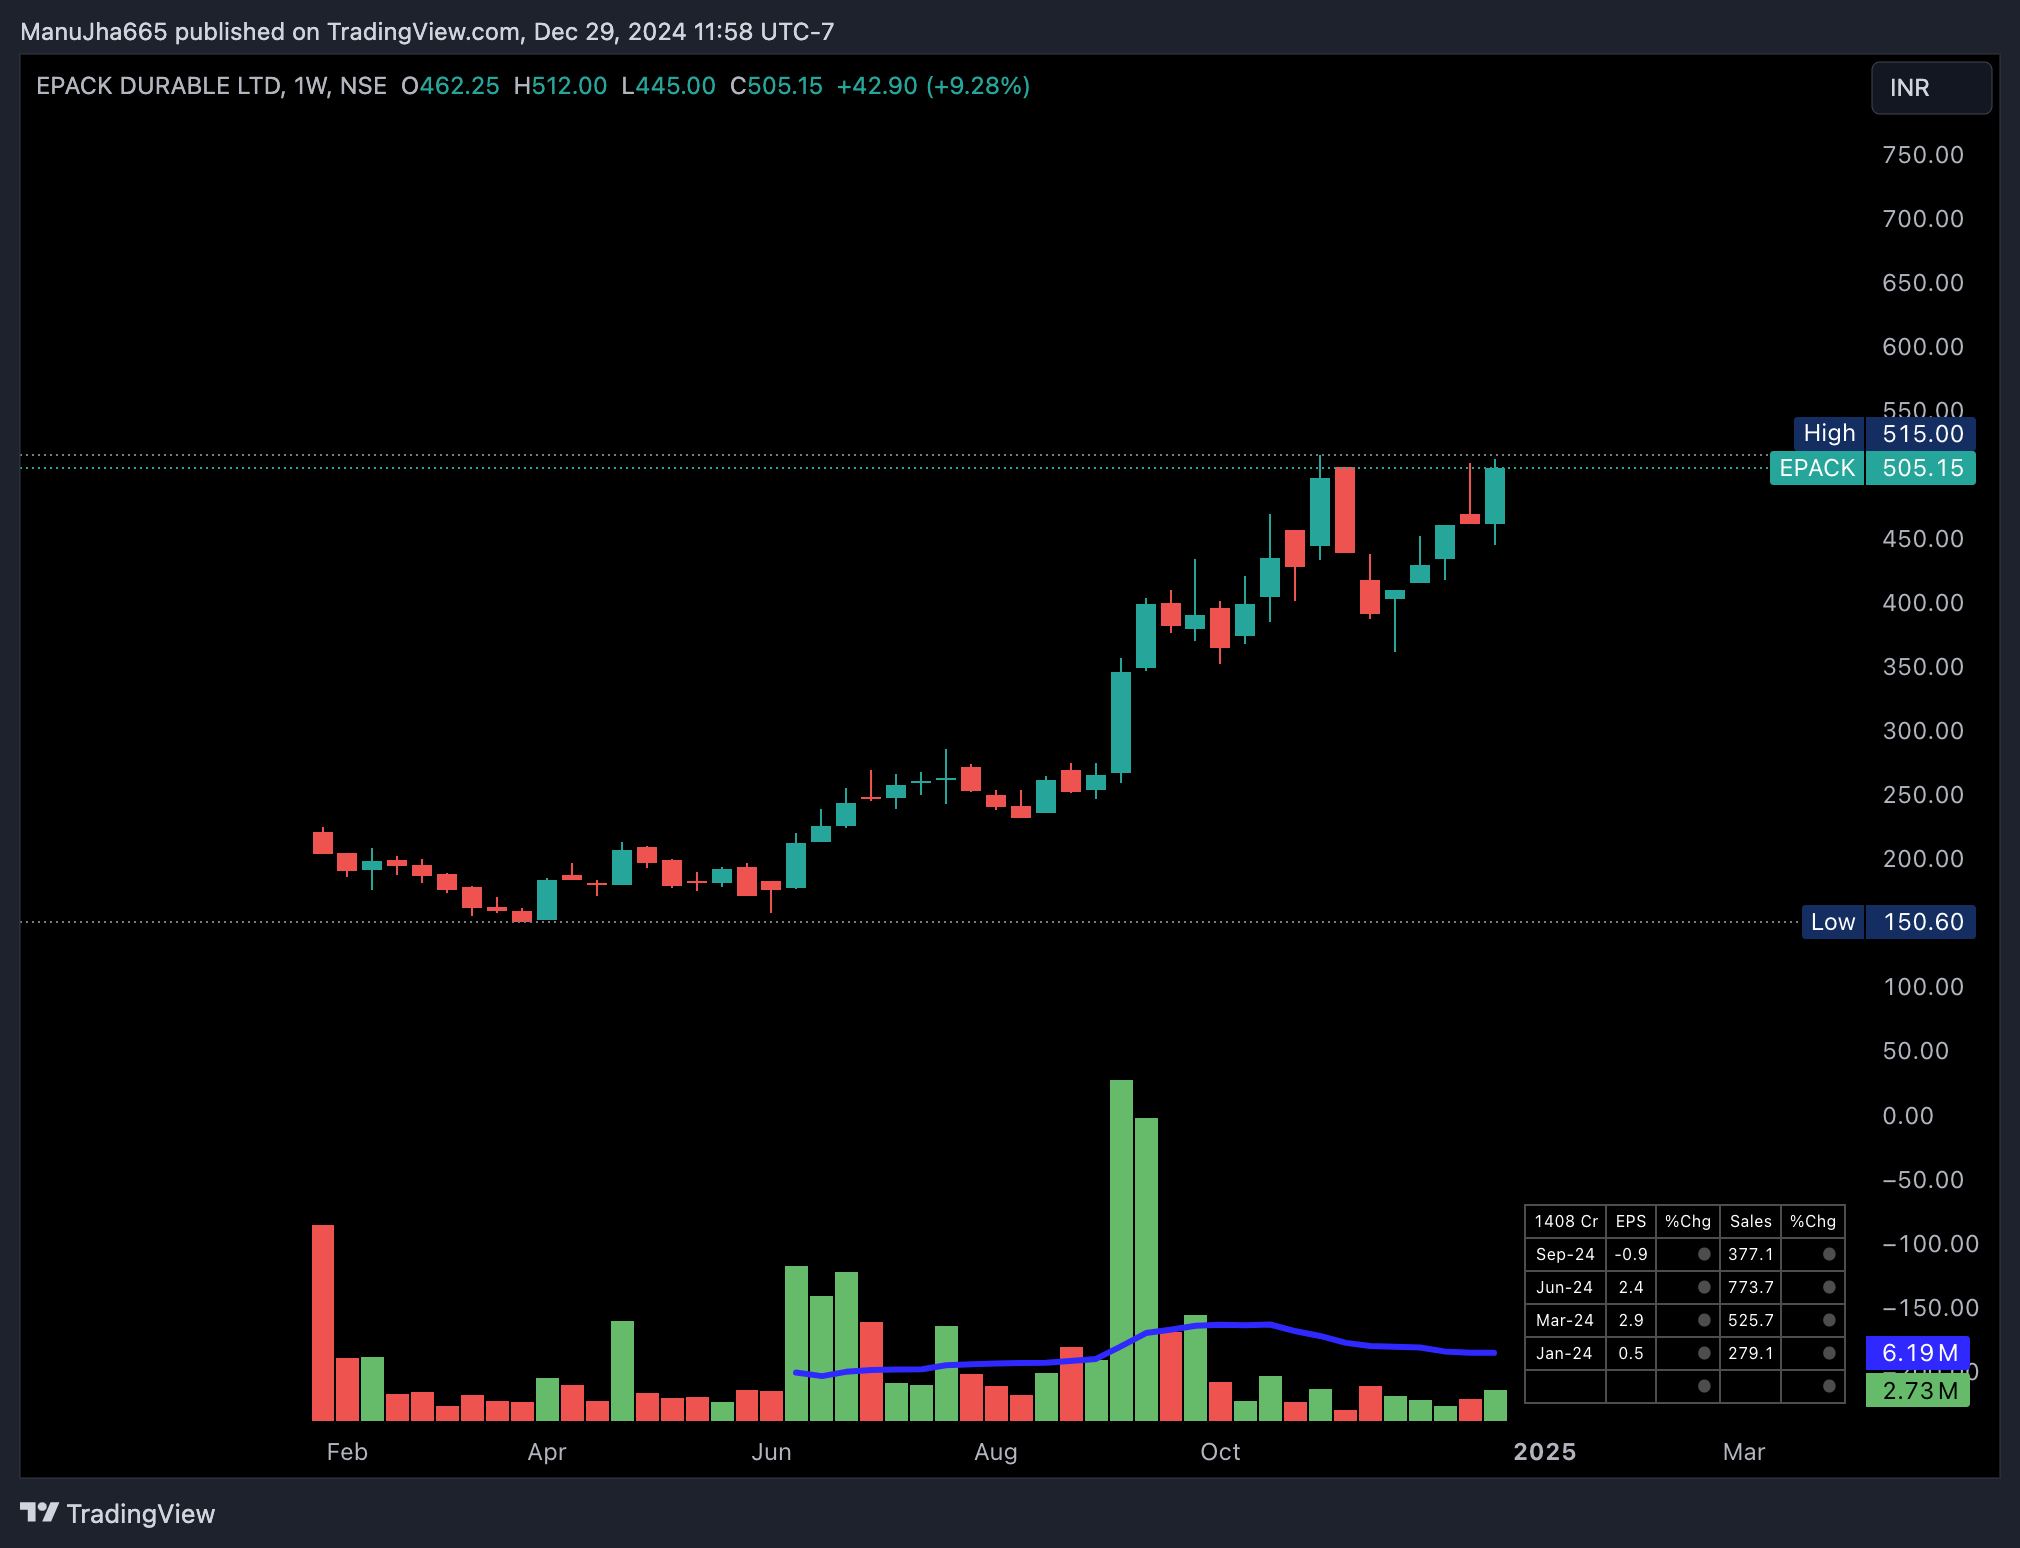
EPACK Durable
Vimta Labs

Triveni Engg

Thanks for reading till now. I hope these 5-7 mins have added some value in your analysis.
Thanks,
Curious Investor