


Momentum or Mayhem? Unpacking the Nifty200 Momentum30 story
IS THE PARTY OVER for NIFTY200 MOMENTUM 30 INDEX ?

🚀 August 25, 2020 – NSE launches the Nifty 200 Momentum 30 Index, a bold new player in the world of factor investing. It quickly becomes the talk of the town among investors who chase trends and ride waves.
Momentum investing, after all, is rooted in a simple but powerful idea:
"What’s hot tends to stay hot... for a while."
But fast-forward to 2025, cracks seem to be appearing. The darling of bull markets is stumbling. Has momentum lost its magic? Or is this just a bump in the road?
Strap in — we’re diving deep into Momentum, Factor Investing, and everything in between:
What is Factor Investing?
Nifty 200 Momentum 30 Index
Index Methodology
The Factor Showdown - Yearly Leaderboard of Factors
Performance Across Market Cycles (Bull, Bear, Recovery)
Rolling Period Outperformance Odds (Momentum, Quality, Value, Low Vol)
Current Sector Representation (2024-25)
Current Top Holdings (Feb 25 snapshot)
Returns against Major Indices
The Recent Slump: Is Momentum Fading? (2022-2024 underperformance)
Bear Market Resilience & Bull Market Outperformance history
Conclusion / Personal view on Nifty200 Momentum 30 ETF
Let’s go !
What is Factor investing ?
Factor Investing is a systematic investment strategy that targets quantifiable drivers of returns — called "factors" — that explain the risk and performance of assets beyond traditional market beta.
Instead of just buying the entire market (like a regular index fund Nifty50 bees, Nifty Midcap100 etc), factor investing focuses on companies with certain characteristics — like:
Momentum: stocks that have been going up tend to keep going up ,
Value: cheap stocks ( Low P/B , P/E anomalies),
Quality: strong financial health & profitability ((high ROE, low leverage)),
Low Volatility: stocks that move less wildly than the rest ((lower standard deviation of returns).
Factor strategies systematically tilt portfolios toward these attributes, expecting risk-adjusted alpha relative to cap-weighted benchmarks to beat the market over time. However, factors exhibit cyclical performance based on macro regimes, liquidity conditions, and investor sentiment and they dont beat the market all the time !
In short, Factor Investing gives you a sharper tool to potentially outperform the market—rather than passively owning every stock, you aim to own the right kinds of stocks.
Now let’s zoom in on the Momentum Factor!
What is the Nifty 200 Momentum 30 Index?
Momentum investing, the core philosophy behind these funds, is based on the principle that stocks with strong past performance tend to continue performing well in the near term.
Tracks the 30 most momentum-driven stocks from the Nifty 200.
Uses 6-month and 12-month price momentum, adjusted for volatility, to determine weights.
Stock weights are capped at the lower of 5% or stock’s free-float market cap weight × Normalized Momentum Score.
Launched in August 2020, but with backtested data stretching all the way back to 2005, giving investors a historical lens on its behavior.
The index automatically adapts to new market trends as stock market leadership shifts over time—always chasing the current winners.

INDEX Methodology

Normalization ensures that stocks with extreme returns or volatility don’t unfairly dominate the ranking and that the score is comparable across different sectors or market caps. It favors stocks that are trending smoothly rather than those that are wildly swinging up and down. Also, it also caps the weight of each stock so that no single company dominates the portfolio.

The index is semi-annually rebalanced (June & December) and adapts automatically as leadership within the market evolves.
Momentum? Value? Quality? Low Vol? Time to settle the score—who’s been the real winner over time?
Factors Investing - Winners keeep changing
Markets are unpredictable—but when we zoom out, patterns begin to emerge. Here's a year-by-year ranking of how each factor performed (Value, Momentum, Quality, Low Vol) along with benchmark index of nifty 200 – showing who won gold and who lagged behind !

Source/Disclaimer: niftyindices, BSE, MOAMC Research. Performance as of close of 30-Sep-09 to 30-Sep-24.
Momentum is the clear leader, ranking in the “Top 2” a whopping 11 times, thriving especially in trending markets.
Quality and Value show balanced profiles but with more downside protection.
Low Vol has a mixed track record – strong defensively (dominated defensive years) but often in the “Bottom 2” in bull runs.
Nifty 200 appears as a laggard, finishing in the “Bottom 2” 12 times, often underperforming its smart-beta counterparts.

Legend :
Low Vol = BSE Low Volatility TRI
Value = BSE Enhanced Value TRI
Momentum = Nifty 200 Momentum 30 TRI
Quality = BSE Quality TRI
Nifty 200 = Nifty 200 TRI
But what happens when market moods change?
Let’s unpack how these strategies behave across different market cycles so you can see where each one shines—and where it struggles.
Performance Across Different Cycles
This matrix presents the CAGR performance of Value, Quality, Low Volatility, and Momentum factors across distinct market regimes (Bull, Bear, and Recovery phases), benchmarked against the Nifty 200 TRI. The data provides empirical evidence on the cyclical nature of factor outperformance, helping investors align factor exposure with prevailing and anticipated market cycles.

Source/Disclaimer: niftyindices, BSE, MOAMC Research. Performance as of close of 30-Sep-09 to 30-Sep-24. All Performance numbers in CAGR. Bear market defined as >20% fall from peak to trough. Recovery defined as the recovery from trough to previous peak. Bull market defined as rising market after recovery.
The below table outlines the historical odds of factor strategies outperforming the Nifty 200 TRI over rolling periods ranging from 1 to 10 years. Momentum and Quality factors display superior consistency, with Momentum outperforming in 100% of 7-year and 10-year periods, followed closely by Low Vol and Quality. Value factor exhibits more cyclical behavior with lower probabilities of sustained outperformance across longer horizons.
Odds of outperformance increase the longer you stay invested.

Source/Disclaimer: niftyindices,BSE. Performance as of close of 16-Sep-05 to 30-Sep-24 . 250 trading days assumed in one year Performance results have many inherent limitations and no representation is being made that any investor will, or is likely to achieve.
Adapts to changing market conditions
The below chart shows how sector weights in a momentum index have shifted over the years. Financial Services consistently held a strong presence, especially in 2019 and 2022. Healthcare surged in 2020 and 2023, reflecting defensive buying during volatile periods. Information Technology dominated in 2021 amid the global tech rally, while Capital Goods gained prominence in 2022 and 2023, indicating a cyclical recovery.
These sector shifts highlight how momentum strategies dynamically rotate across sectors based on prevailing market trends.
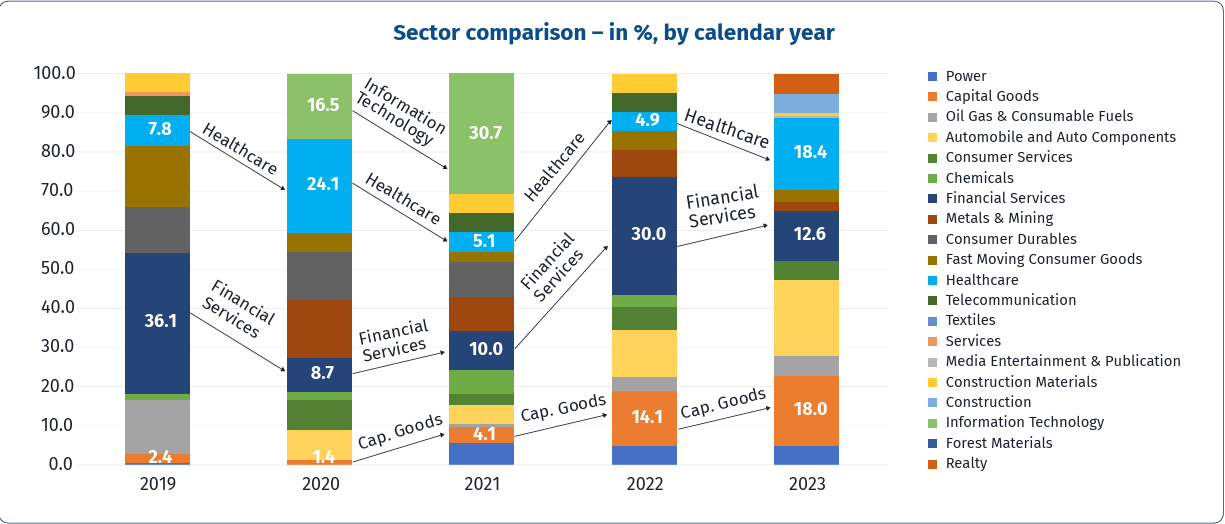
Current Sector Representation
📌 Sectoral Shifts in 2024-25:
What’s out ?
🚫 Power, Industrials & Old Economy cyclicals.
Once portfolio darlings like Auto/Auto ANC (down from 17% to just 5%) and Electrical Equipment, Power, Defence have been either rapidly sold off.
What’s in ?
✅ Tech & Healthcare uptrend:
IT - Software now dominates with a massive 25% weighting.
Healthcare and Retail are quietly rising, now at 14% and 13% respectively.
Counsumer Durables, Consumer Services—once forgotten—are making a stealth comeback.
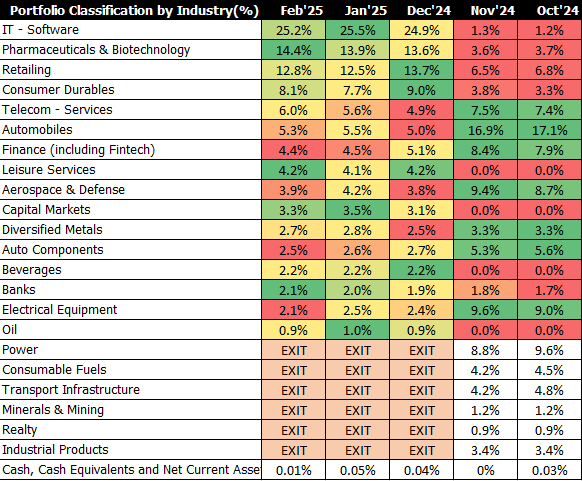
This isn’t just a momentum shift, it’s a clear tilt towards growth, consumption, and resilience.
Below is the current (Feb’25) distribution of sectors in the index.
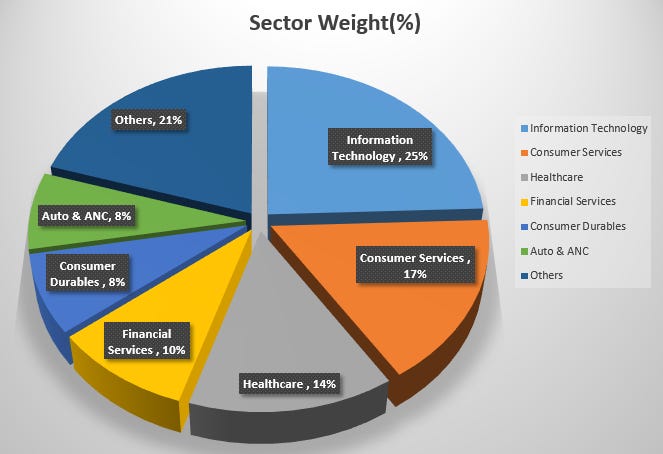
Source: NSE Indices, As of Feb 28, 2025.
Current Top Holdings

Source: NSE Indices, As of Feb 28, 2025.
Returns against major indices
Over the last 5 years, it delivered 154% returns, outpacing Nifty 50's 125% and even NIFTY 200 (139%) and NIFTY 500 (147%)—highlighting its superior trend-following capabilities. (as on 15 Mar’2025)

📉 The Recent Slump: Is Momentum Fading?
Momentum investing thrives in trending bull markets, but struggles in volatile and correction-heavy periods. From 2022-2024, the index has seen significant drawdowns (-27% in the last 6 months!), underperforming broader indices like NIFTY50 (-12%) and NIFTY200 (-15%) in the recent correction.
🔍 Why the Underperformance?
✅ Sector rotation saw momentum-heavy small & midcaps get hit.
✅ High volatility made trend-following difficult.
✅ Valuation fatigue caused profit booking.
Bear Market Resilience & Outperformance in Bull Runs:
How has Nifty200 Momentum30 held up in past bear markets?
📉 Max Drawdown from ATH:
2008 GFC : Nifty50 (-64.6%) | Nifty200M30 (-67.9%)
2020 Covid Crash: Nifty50 (-39.6%) | Nifty200M30 (-34.2%)
2022-23 Correction: Nifty50 (-13.2%) | Nifty200M30 (-14.8%)
The below table illustrates the annual returns of the Nifty200 Momentum 30 Index vs traditional benchmarks—Nifty50 and Nifty200—from 2006 through 2025 YTD.
The "Beats" columns indicate binary outperformance relative to the two broad indices.
Nifty200 Momentum30 has outperformed Nifty50 in 14 out of the last 20 years.
In strong bull markets, it beat Nifty50 by more than 15% each time.
The Nifty200 Momentum30 Index has outperformed the Nifty200 Index in 15 of the past 20 calendar years.
In pronounced bull markets, the index delivered alpha exceeding +15% over the Nifty200 benchmark, highlighting its pro-cyclical nature and tendency to amplify gains during strong market rallies.

Is Investing in a Nifty200 Momentum 30 ETF a Good Idea?
Momentum investing works best when markets are trending strongly upward. However, the sharp drawdowns in 2022-24 remind us that momentum can be high risk and volatile in downturns. Momentum Factor also faces higher and longer drawdowns.
I consider myself as a long-term investor with a higher risk appetite and the patience to ride out volatility, and as per the data feel that the Nifty200 Momentum 30 ETFs can be a powerful wealth-creating strategy.
Thanks for reading through!
Other Articles
Book Summary : 📚Outlive: The Science and Art of Longevity
Credits
Motilal oswal AMC
HDFC AMC
NSE indexogram