


Month's Price Volume Action- 23rd Feb'25
All the Price Volume action at one place !

Hello All,
In February 2025, Indian equity markets showed signs of stabilizing after a prolonged decline. The Nifty 50 and BSE Sensex managed to recover from January's losses, aided by easing global concerns and reduced foreign investor selling.
FII outflows, which had surged to ₹87,000 crore in January, moderated to ₹37,000 crore, offering some relief to the markets. The cooling of the Dollar Index and USDINR further supported investor sentiment.
Sectorally, metals and PSU stocks emerged as the best performers, while most other sectors also ended the month on a positive note. With the earnings season and major economic events now behind, expecting the market to consolidate for an extended period, giving investors like us to do some research and bargain hunting with opportunities. However, caution remains due to lingering global uncertainties (read Trump and Elon) and high valuations.
Now, Lets deep dive ! ☕️
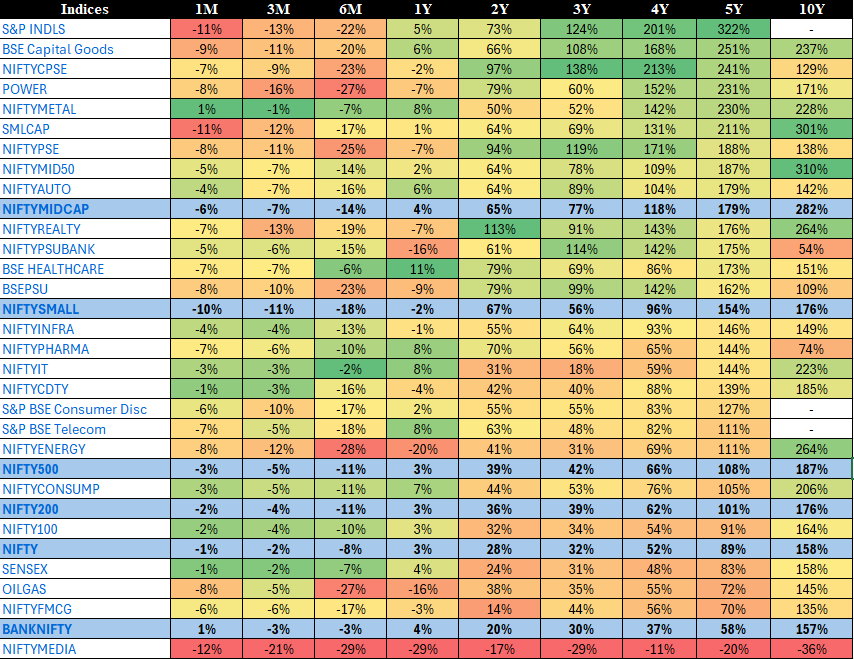
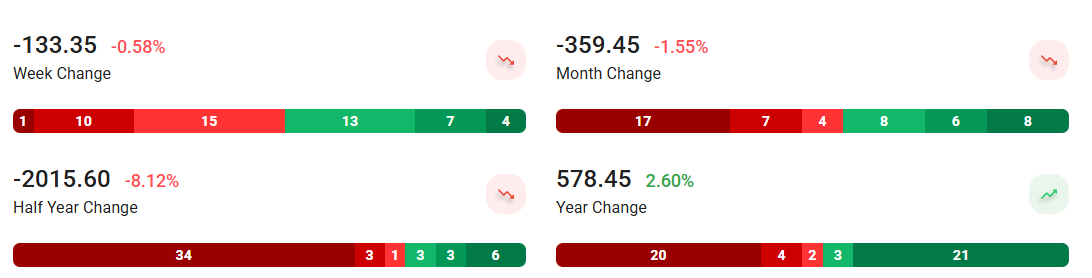
Returns on Indices across time periods

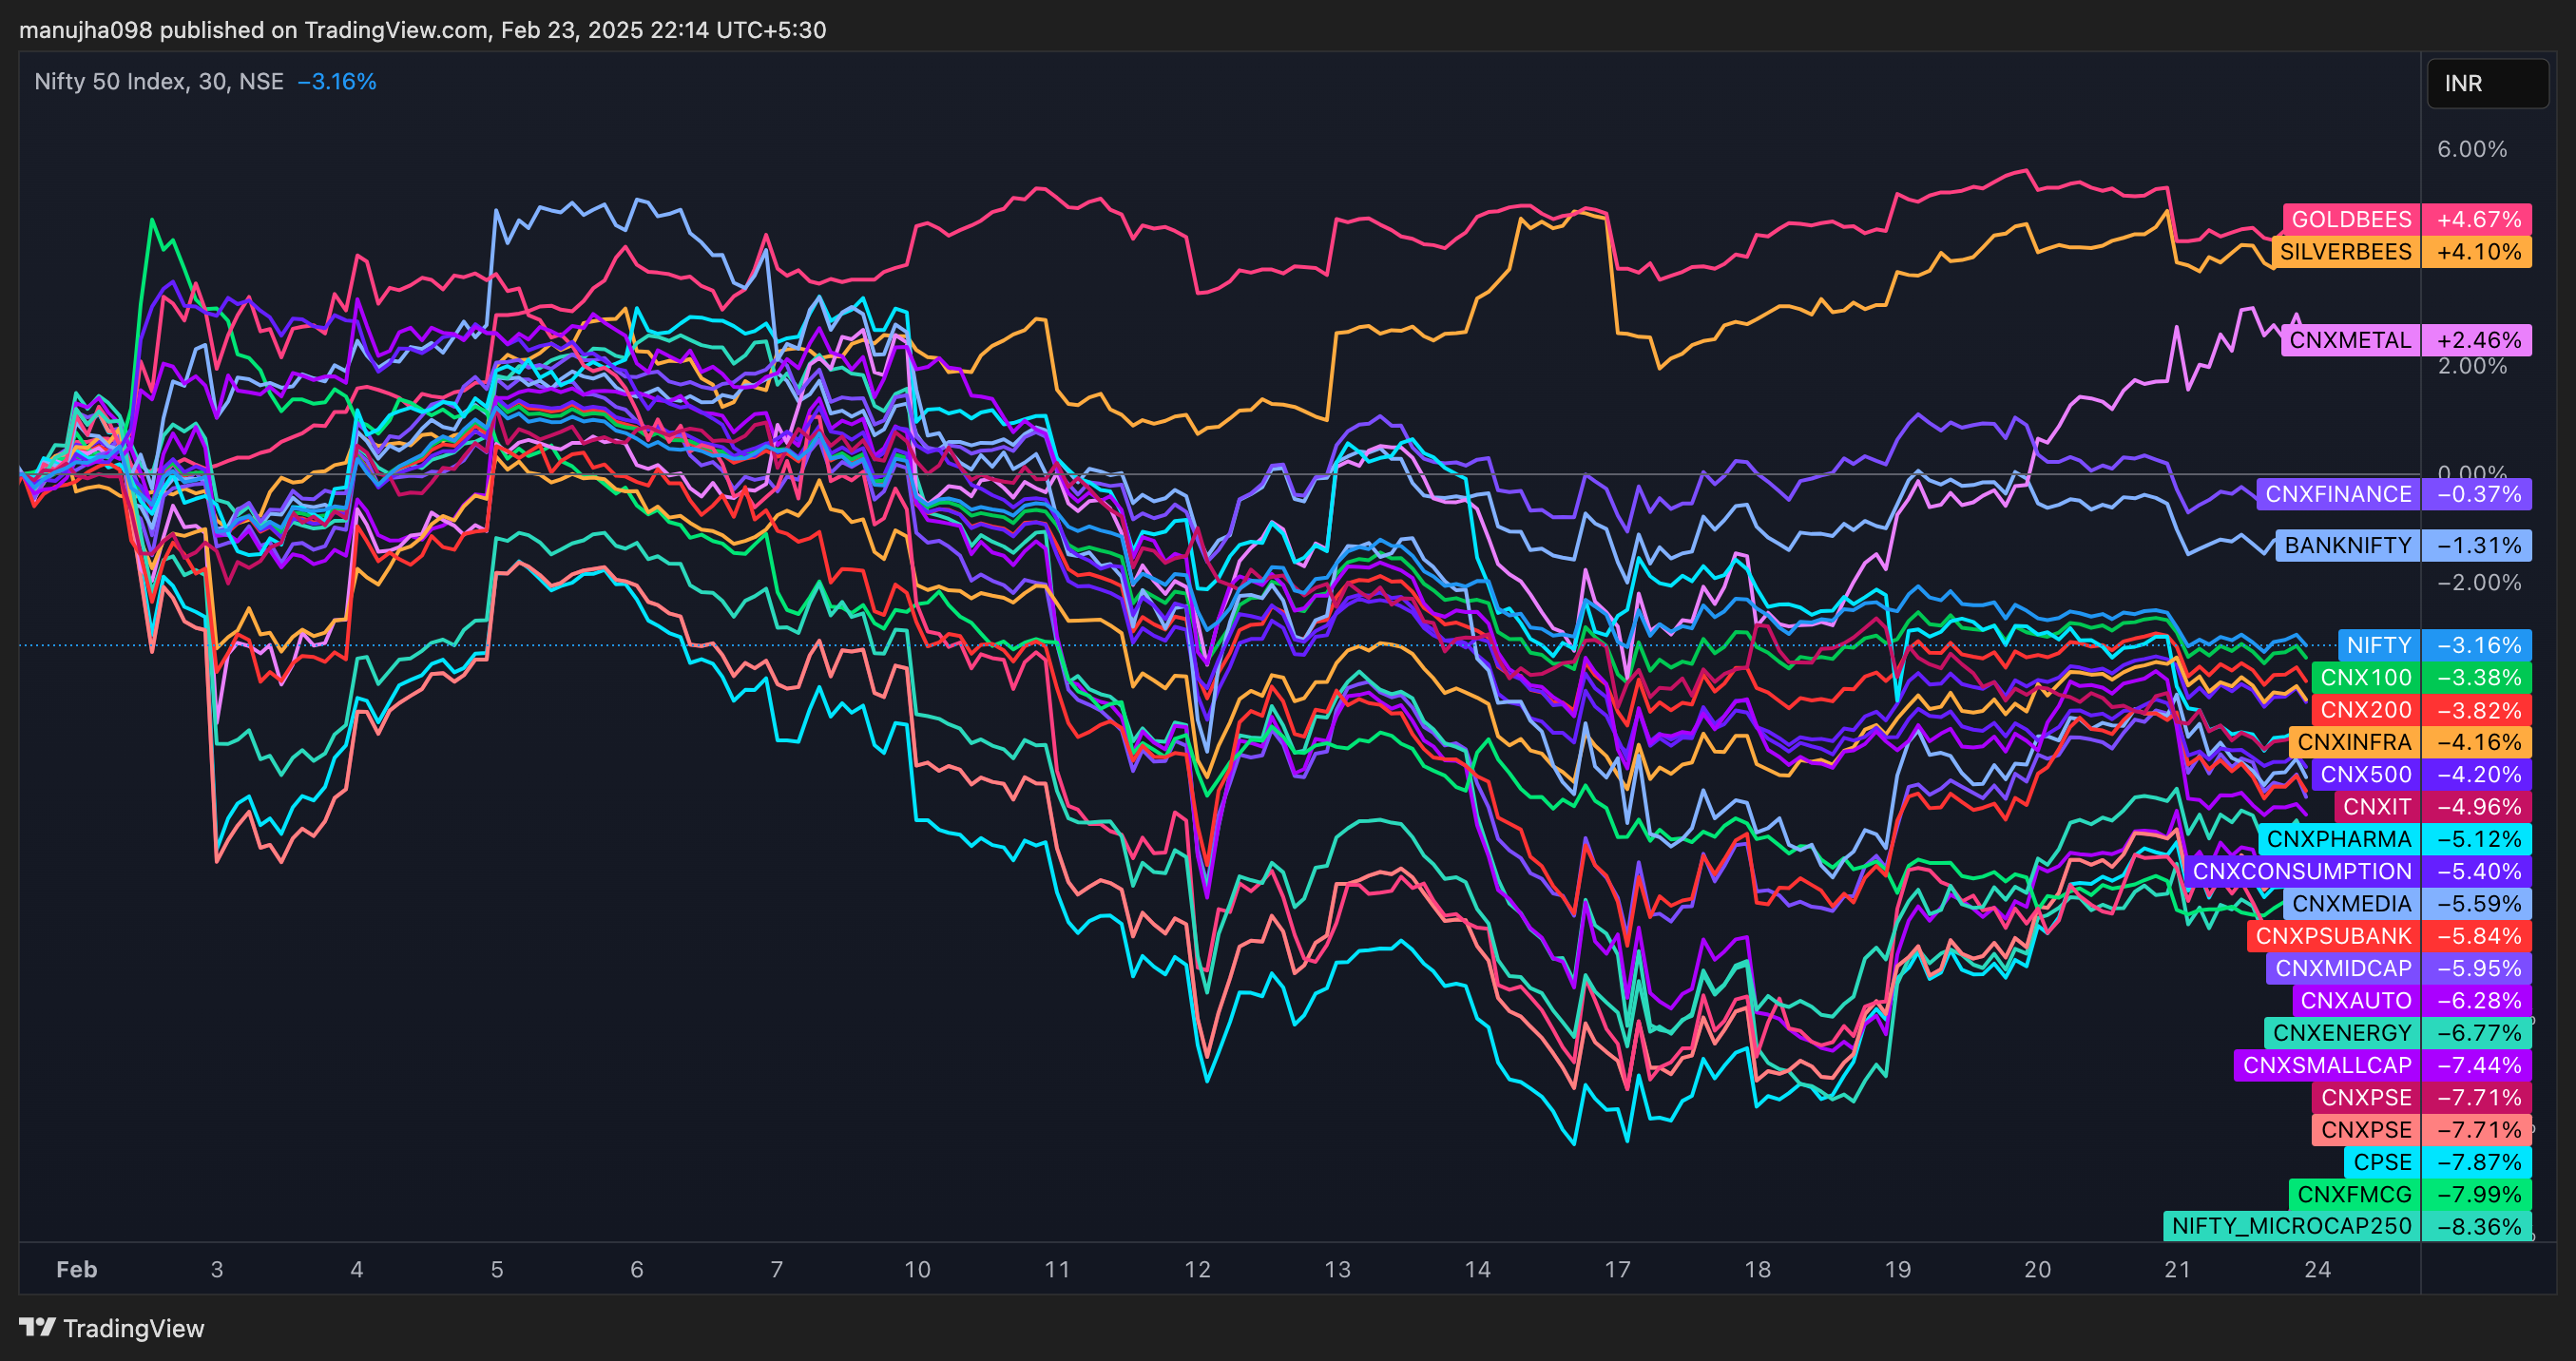
Returns across Sectors in February
Only Metal was the sector with positive return(+2.5%). Interestingly once again, returns on Gold & Silver (4%) were the other instruments which gave a postitive return. FMCG (-8%) and Energy (-7%) were the sector which gave the lowest returns. Nifty50 gave -3.2% whereas BankNifty gave -1.3% returns.
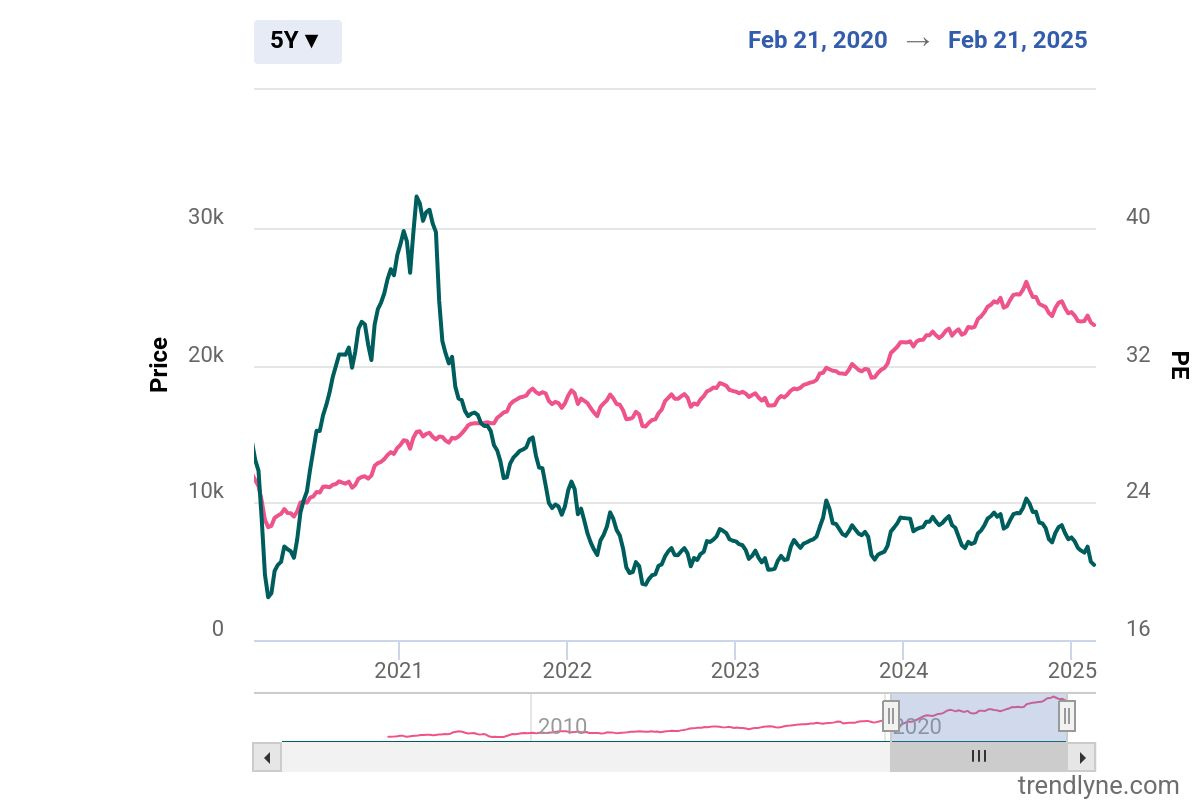
Nifty Smallcap100
NIFTY smallcap100 had broken the 50WEMA for the first time after May2023 last month. Now in 2nd Week of Feb, it has broken and gone below the 100WEMA (yellow).

In a month , PE dropped from 34 in Dec end to 31 in Jan end and now to 26 this week.

The PE of Nifty SmallCap100 is at 26.8 Some drop now can be observed as over last month, Out of 100, only 16 stocks have gained more than 5% whereas 84 gave negative returns.


How to read this ?
For 5Y, returns are max for S&P Industrials at 337% (Greenest) and min for Nifty Media at -13a% (Red). Similarly, one can check for each time period. The table is sorted by 5Y returns.

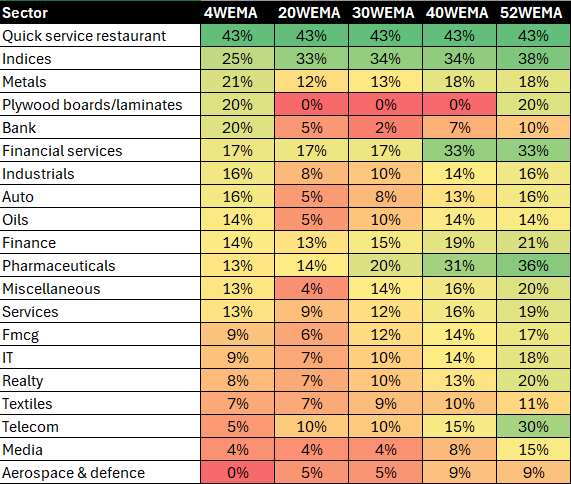
The below table includes the 4-week (4W), 20-week (20W), 30-week (30W), 40-week (40W), and 52-week (52W) moving averages. Each cell represents the percentage of total stocks in that sector, which are above the corresponding exponential moving average.


Nifty 50 Returns over last month
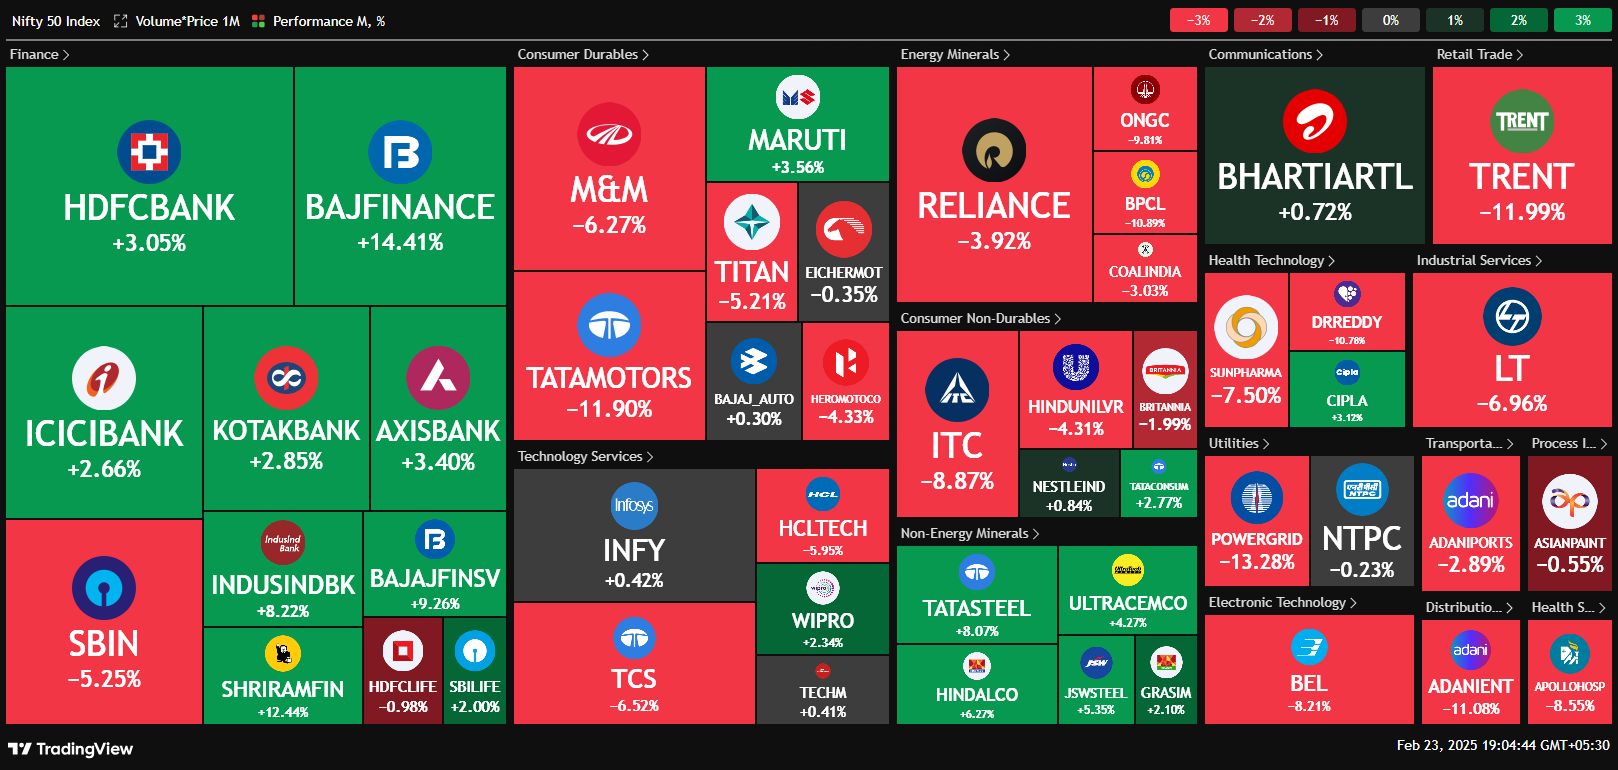
Out of 50, 21 stocks gave >5% returns in last 1 year and only 6 gave >5% in last 6 months.
→ In last 1 year, 21 have beaten the Nifty 50 returns (2.6%).
→ None out of 50, gave >50% returns in 1 year. . None gave more than 100%, our earlier benchmark :)
→ Highest returns is 44% by Bharti Airtel
→ While 26 gave negative returns in last 1 year. Adani Ent, IndusInd & Tata Motors were the top 3 losers (all dropped more than -25%).


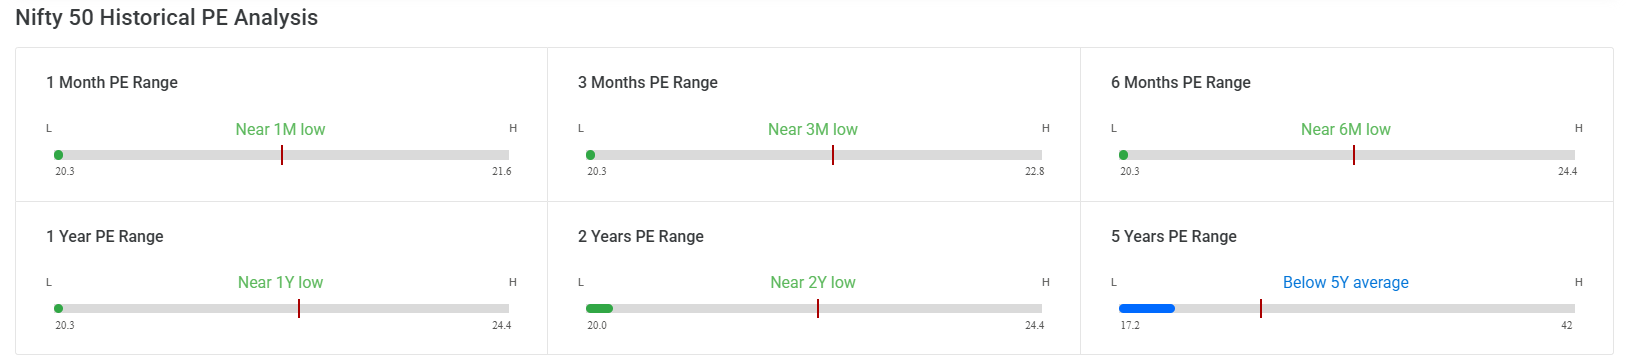
The Current PE = 20.3
Nifty 50 Historical Avg PE at different time periods are :
1M = 20.9 ; 3M = 21.6 ; 6M = 22.4
1Y = 22.5 ; 2Y = 22.2 ; 5Y = 24.8

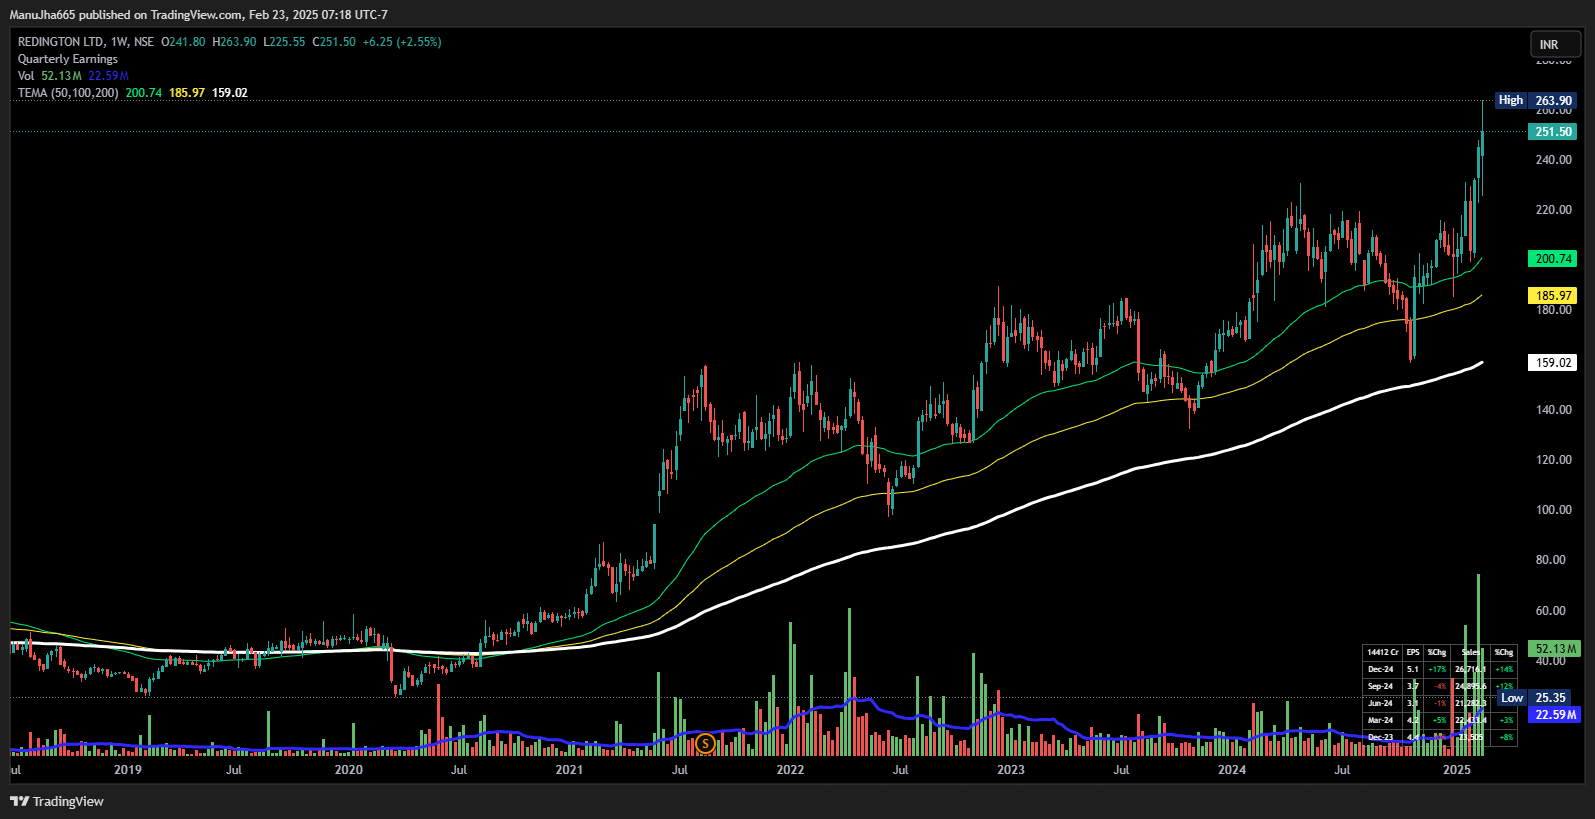
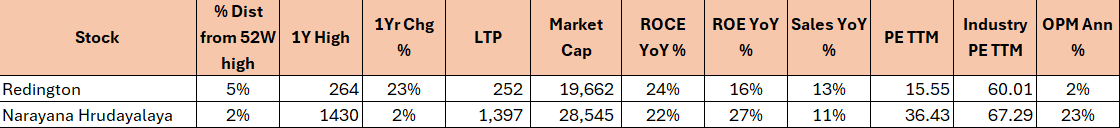
"Stocks Touching 10-Year High" signifies that a stock has reached its highest price level in the past decade. This indicates long-term strong performance and positive market sentiment. It suggests robust business growth and investor confidence, potentially attracting more interest and indicating sustained upward momentum. However, it may also prompt caution regarding overvaluation. There can be others also which might be not part of the list but sharing here only those which have good ROCE/ROE/OPM/Revenue growth and also not overvalued (NIFTY 500).
Redington
Stocks with Growing Momentum


Great momentum stocks indicating strong short-term and medium-term performance, driven by positive news, earnings reports, or market trends. Do note the valuations of the stocks!


Stocks at 52-Week High indicates that a stock has reached its highest price in the past year, reflecting strong performance and positive market sentiment. This milestone can signal upward momentum but may also suggest potential overvaluation. Investors often watch these stocks for further gains or reassess their strategies based on this performance indicator. For some traders, a stock hitting a 52-week high might signal a breakout, suggesting that the stock could continue to rise if it surpasses previous resistance levels.

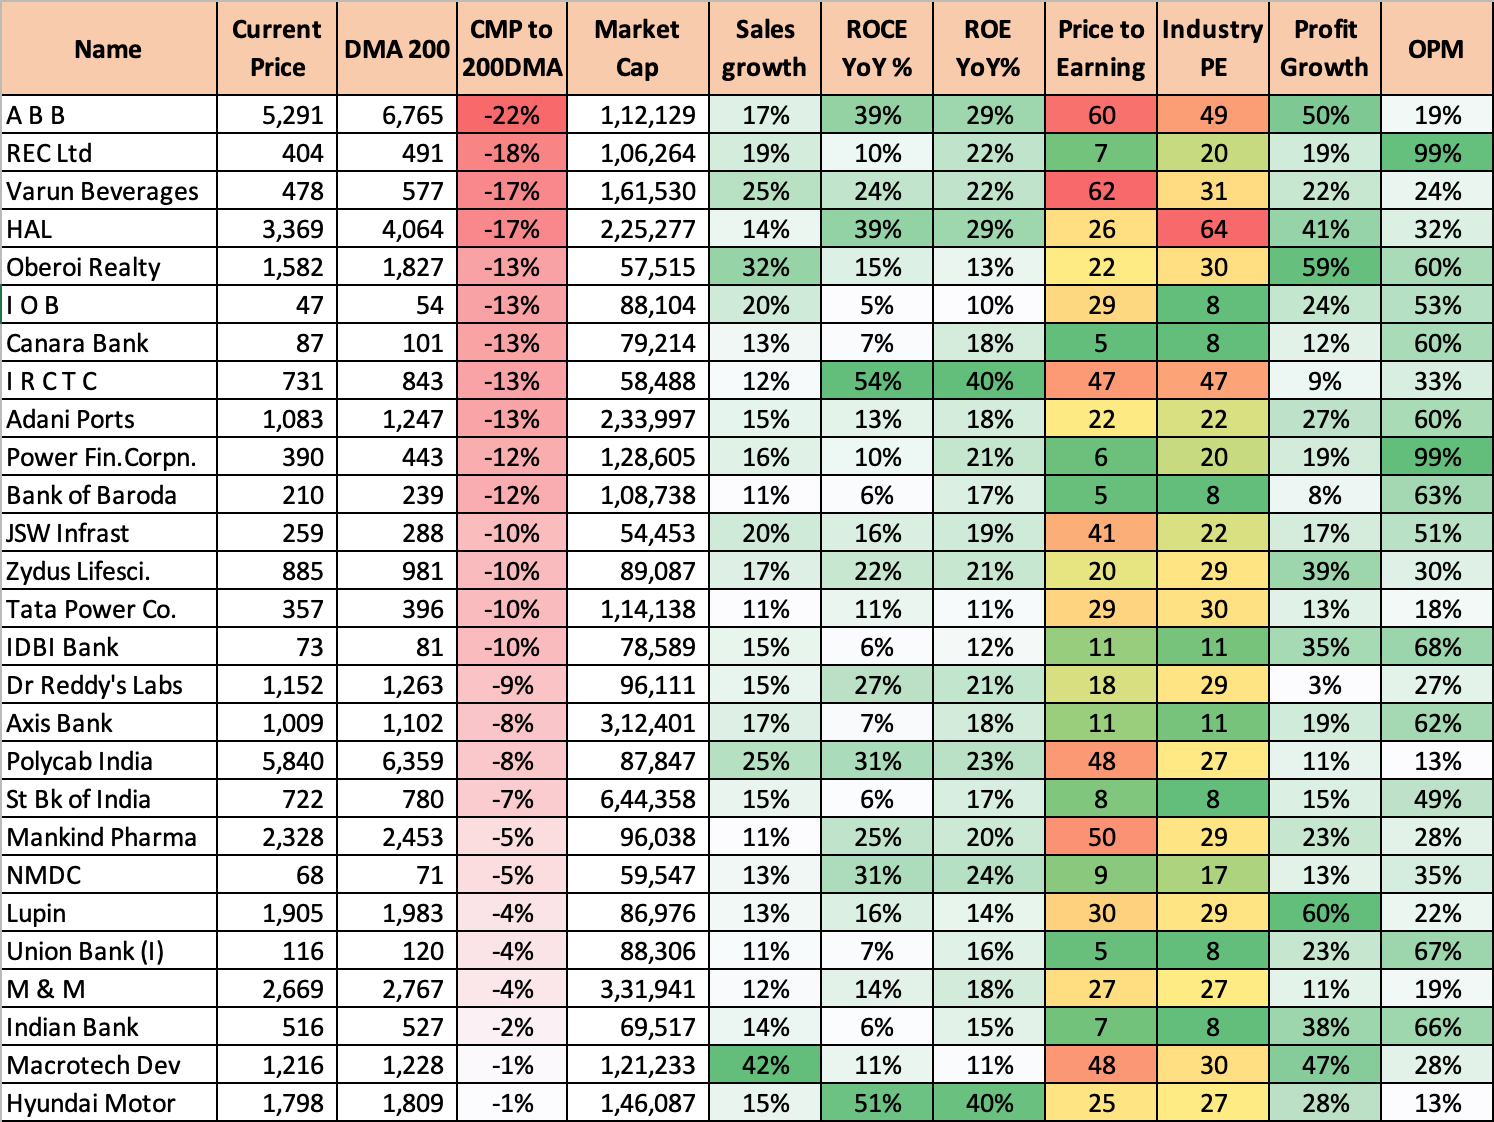
In technical analysis, the 200-day DMA is a long-term trend indicator. When the current price is below this level, it might signal a bearish trend or a downturn. While other aspect is that these leading stocks may be temporarily undervalued, presenting a potential buying opportunity for investors who believe the stock will revert to its mean or rise above the 200-day DMA again especially where the valuations are sane.

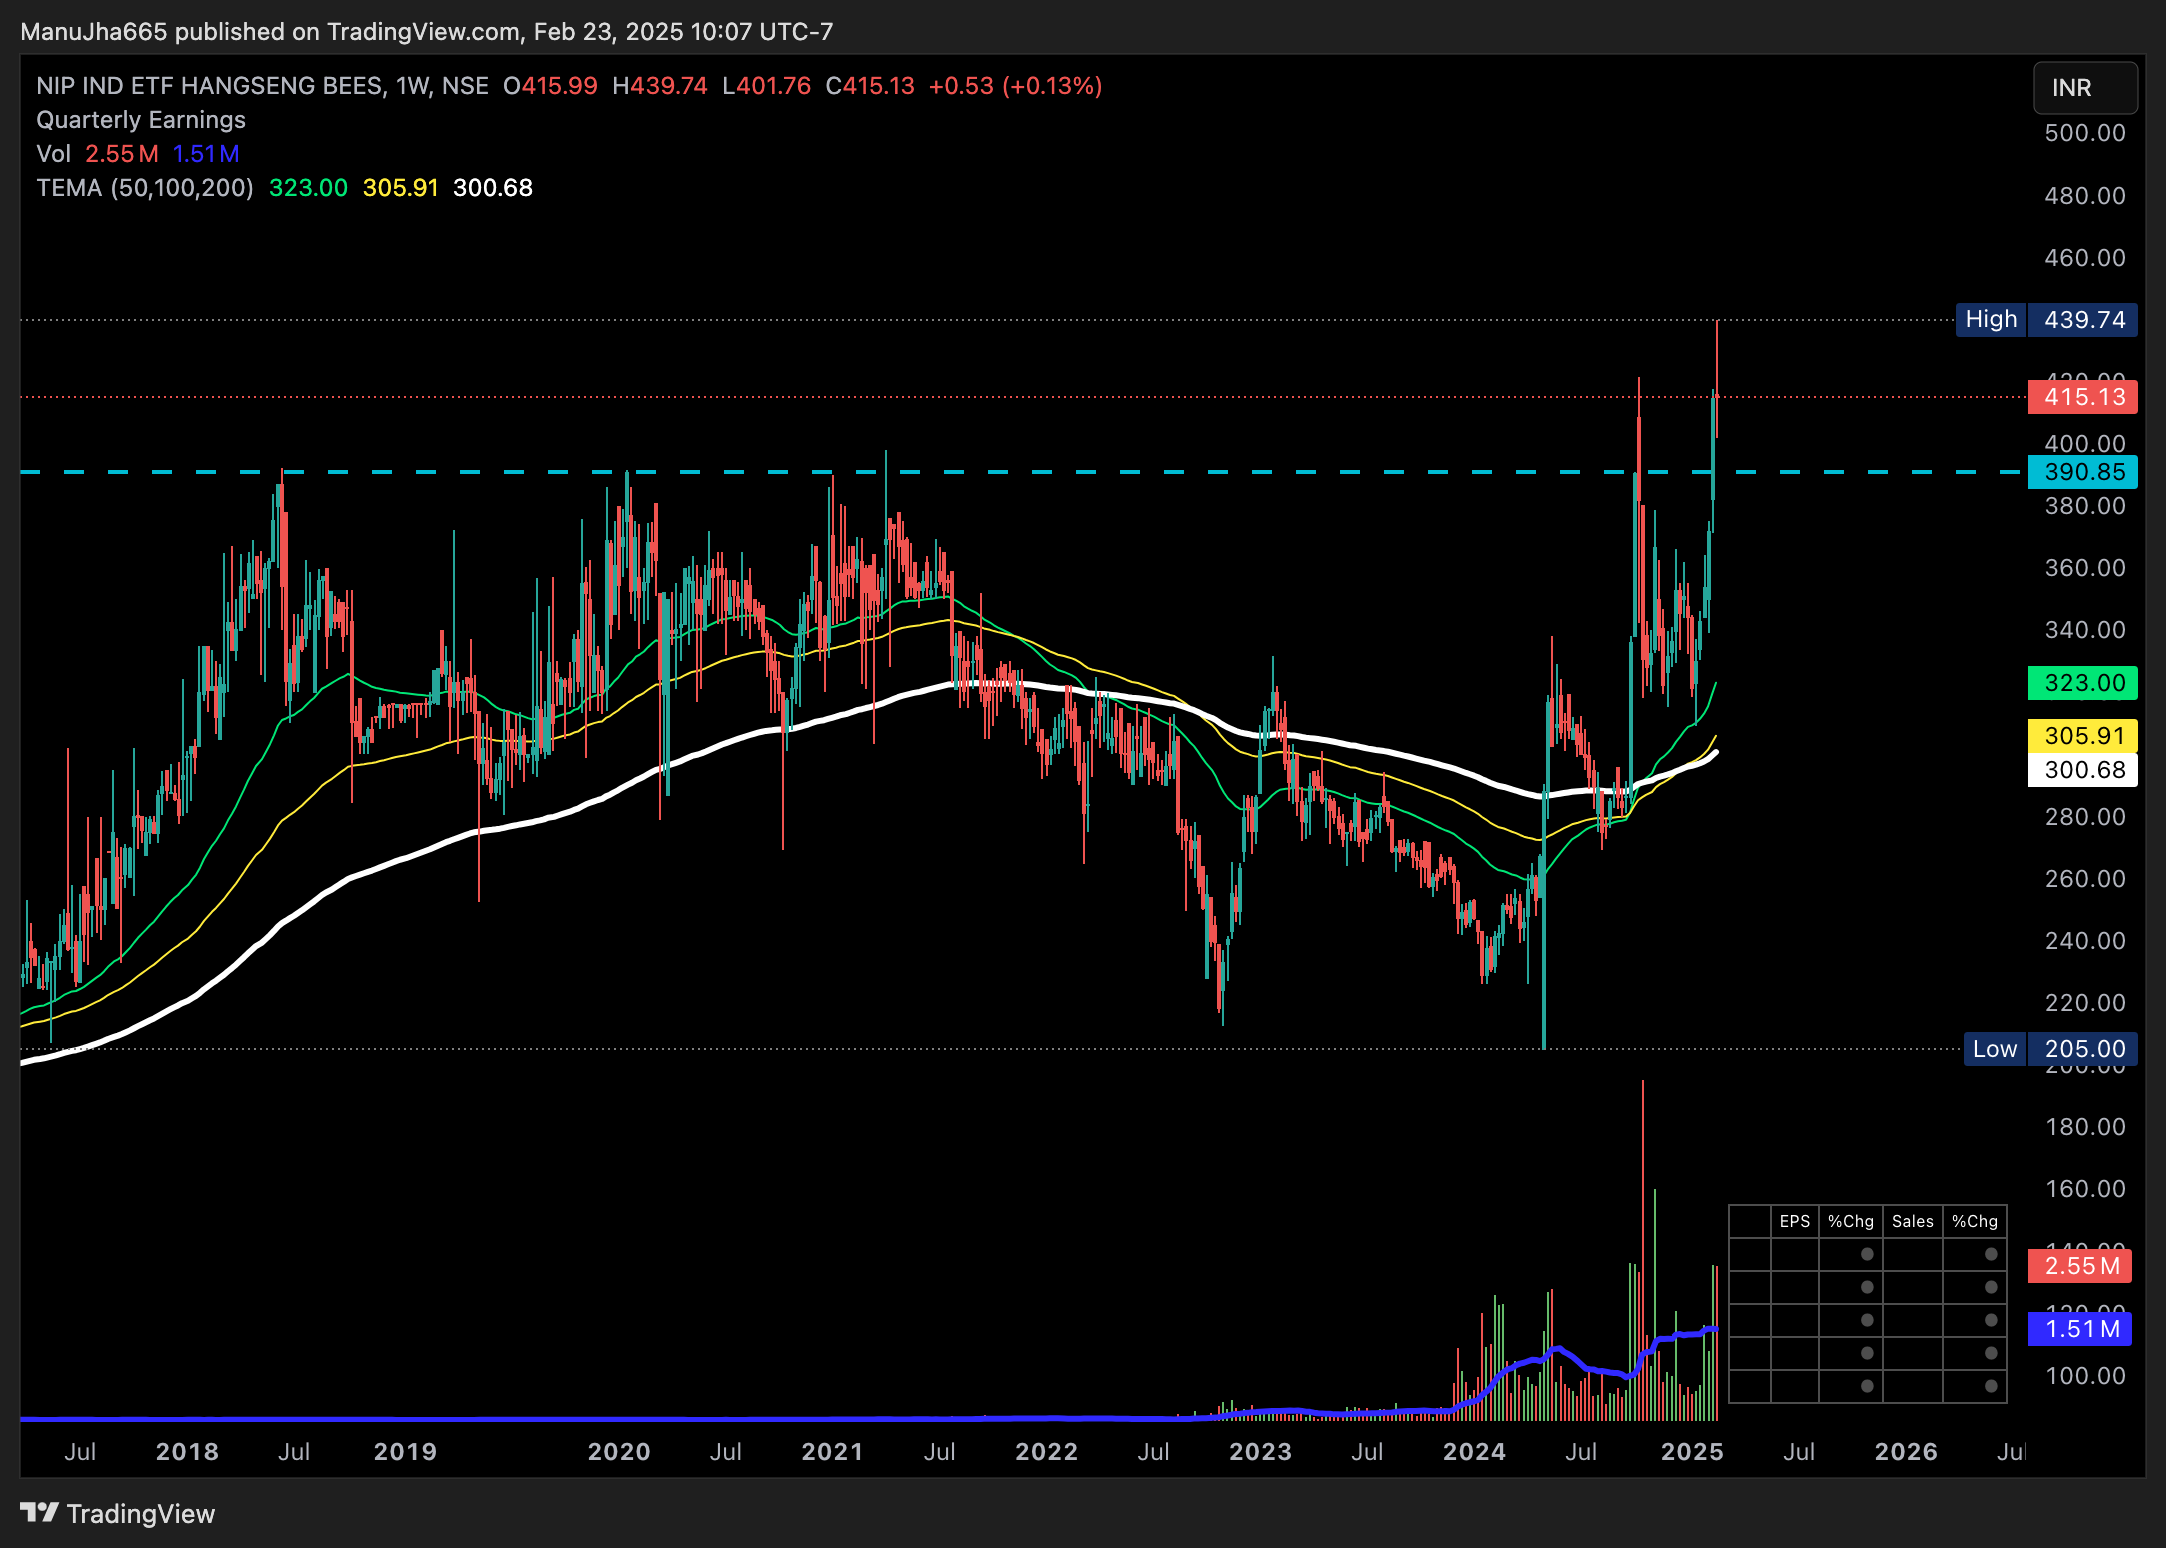
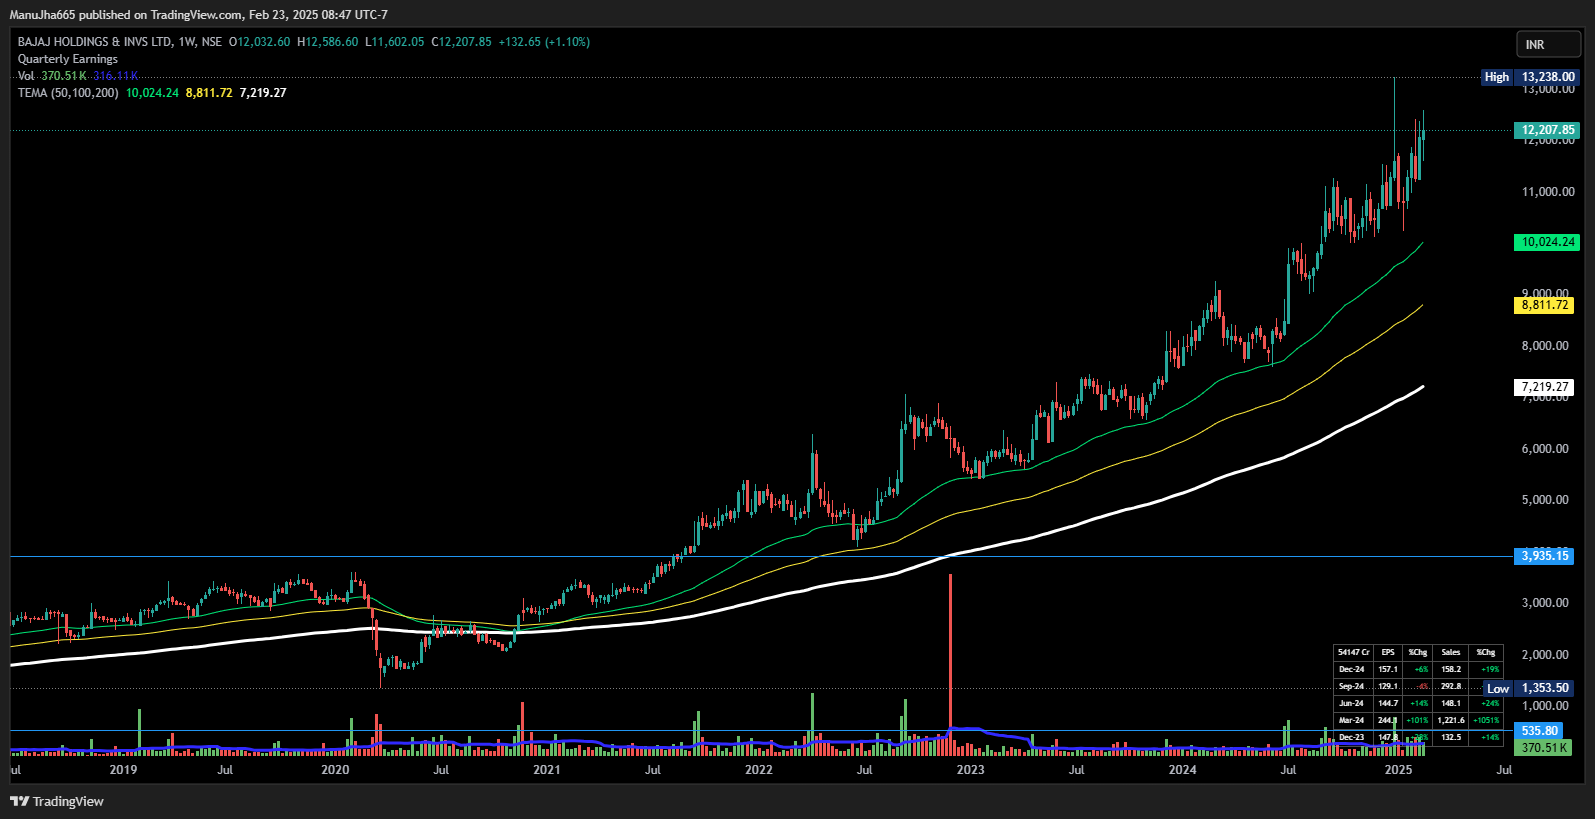
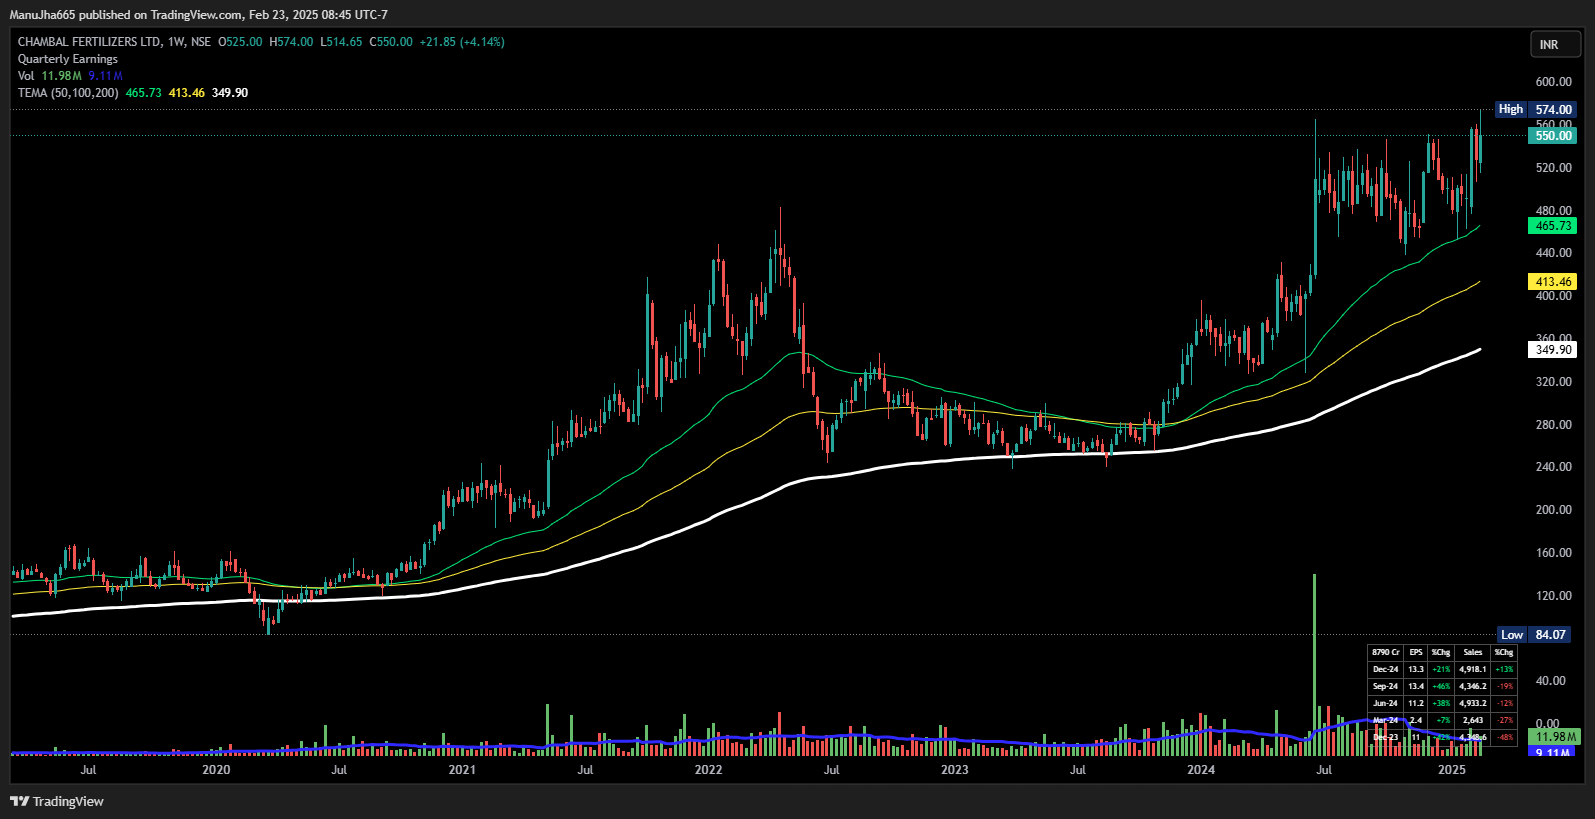
Near 52 week low but are good stocks fundamentally, If one would like to do some bottom fishing would be from one of these with sane valuations and sector uptrend.


HNGSNGBEES
Aarti Pharma

Narayana Hrudayalaya

Bajaj Holdings
Chambal Fertilisers
Thanks for reading till now. I hope these 5-7 mins have added some value in your analysis.
Thanks,
Curious Investor