


Month's Price Volume Action- May'25
All the Price Volume action at one place !

Dear Readers,
Another month draws to a close — and this one brought with it not just fresh earnings data, but renewed evidence that markets can thrive, even amid uncertainty.
📈 Smallcaps led the charge, with the Smallcap 100 up 8%, followed by Midcap 150 at 5%, Nifty 500 at 3%, and Nifty 50 at 1.6%. After months of playing catch-up, midcaps have finally closed the gap with largecaps, while smallcaps continue to outpace — powered by strong earnings and continued domestic fund flows.
🏭 Defence & Aerospace emerged as the top-performing sector, delivering an eye-popping 21% return this month. Other outperformers included Capital Markets, Media, EVs, PSU Banks and Autos. Meanwhile, sectors like Pharma, FMCG, Oil & Gas, and even Bank Nifty lagged behind — signalling a clear rotation in market leadership.
But here’s the real story beneath the surface:
💡 We’re in a earnings-driven phase — where stocks delivering strong results are rewarded, while others languish. It’s a healthy sign. Markets are rewarding fundamentals again.
Now, Lets deep dive ! ☕️
Returns on Indices across time periods

Returns across Sectors in May
This months trend tell a very different story: Defence (+24%) and Capital Markets (+12%) stole the spotlight, while Metals, Auto and Realty gennerated some alpha compared to Nifty. Broader indices like Nifty 50 and CPSE barely stayed positive, while sectors like Pharma, FMCG, and Gold struggled for momentum and stayed in red.

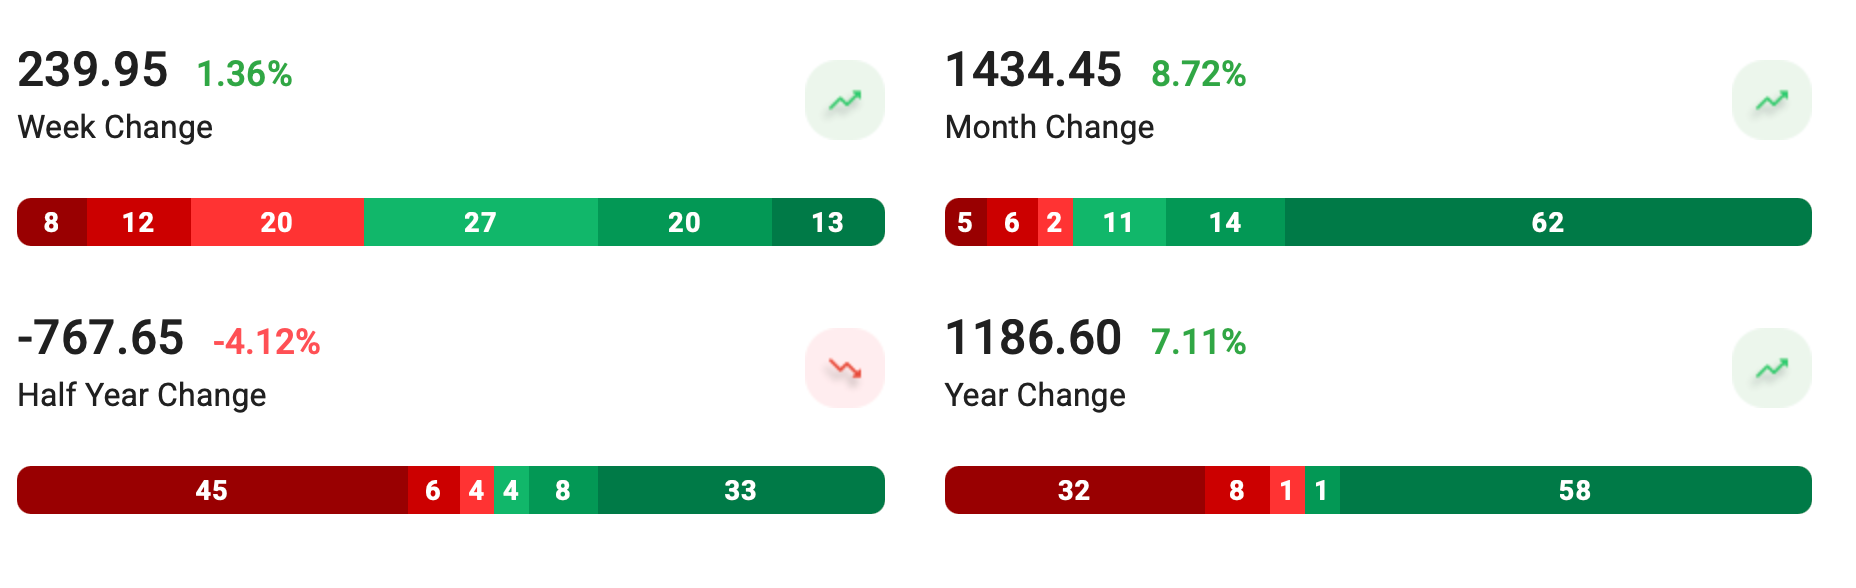
Nifty Smallcap100
NIFTY smallcap100 moved 3100 points (22%) since Feb’25. It is now above 50, 100 and 200 WEMA.

PE has now moved to 31.7 from 26.8 in Feb (lowest).

Out of 100, 62 stocks have gained more than 5% in May whereas 13 gave negative returns. In an year, 58 stocks gave more than 5% returns.


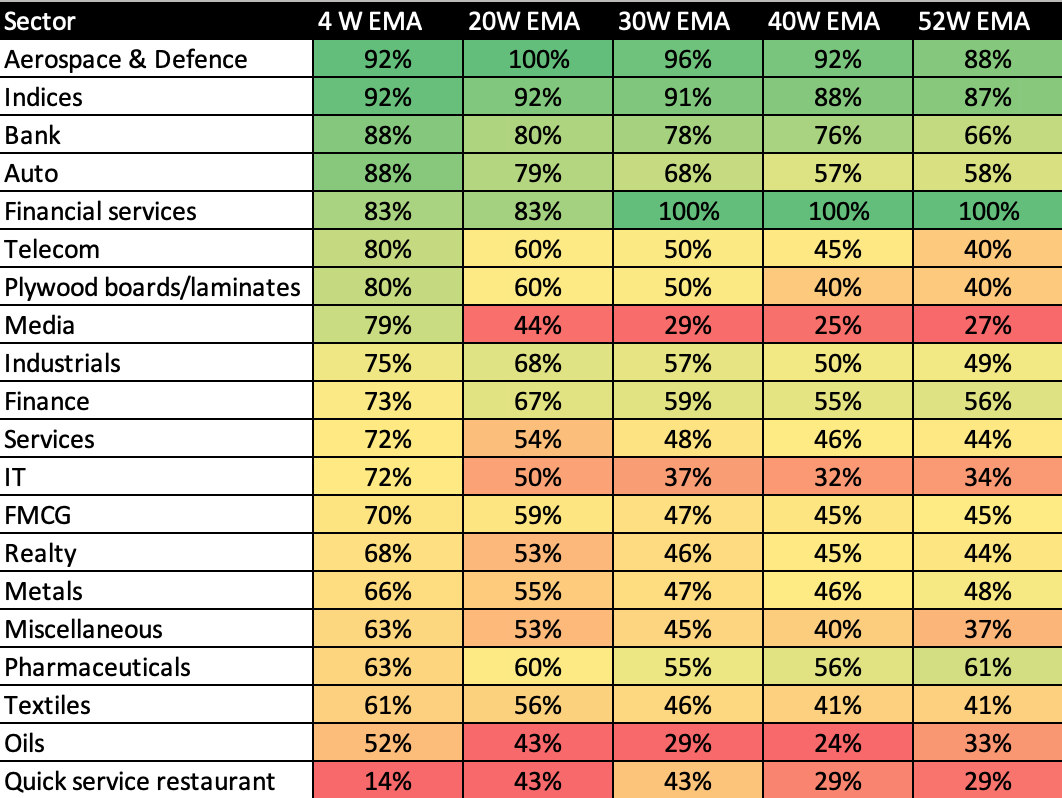
How to read this ?
For 5Y, returns are max for S&P Industrials at 607% (Greenest) and min for Nifty Media at 45% (Red). Similarly, one can check for each time period. The table is sorted by 5Y returns.


The below table includes the 4-week (4W), 20-week (20W), 30-week (30W), 40-week (40W), and 52-week (52W) moving averages. Each cell represents the percentage of total stocks in that sector, which are above the corresponding exponential moving average.


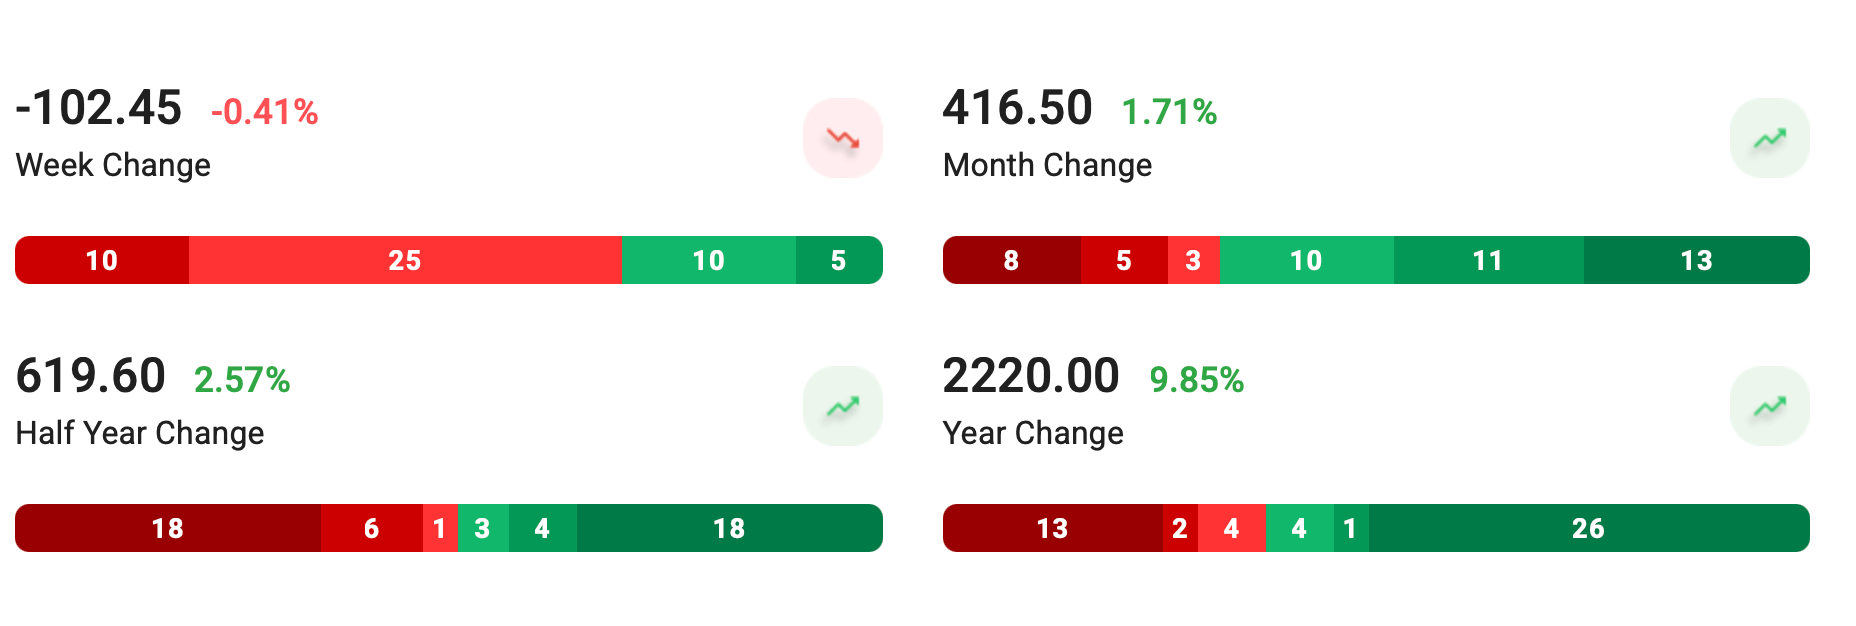
Nifty 50 Returns over last month

Out of 50, 26 stocks gave >5% returns in last 1 year and only 13 gave >5% in last 6 months.
→ In last 1 year, 23 have beaten the Nifty 50 returns (9.85%).
→ None out of 50, gave >50% returns in 1 year. None gave more than 100%, our earlier benchmark :)
→ Highest returns is 41% by HDFC Life Ins
→ While 19 gave negative returns in last 1 year. IndusInd, Tata Motors & Adani Enterp. were the top 3 losers (all dropped more than -20%).


The Current PE = 22.3
Nifty 50 Historical Avg PE at different time periods are :
1M = 22.18 ; 3M = 21.32 ; 6M = 21.4
1Y = 22.1 ; 2Y = 22.2 ; 5Y = 24.8


"Stocks Touching 10-Year High" signifies that a stock has reached its highest price level in the past decade. This indicates long-term strong performance and positive market sentiment. It suggests robust business growth and investor confidence, potentially attracting more interest and indicating sustained upward momentum. However, it may also prompt caution regarding overvaluation. There can be others also which might be not part of the list but sharing here only those which have good ROCE/ROE/OPM/Revenue growth and also not overvalued (NIFTY 500).


Great momentum stocks indicating strong short-term and medium-term performance, driven by positive news, earnings reports, or market trends. Do note the valuations of the stocks!


Stocks at 52-Week High indicates that a stock has reached its highest price in the past year, reflecting strong performance and positive market sentiment. This milestone can signal upward momentum but may also suggest potential overvaluation. Investors often watch these stocks for further gains or reassess their strategies based on this performance indicator. For some traders, a stock hitting a 52-week high might signal a breakout, suggesting that the stock could continue to rise if it surpasses previous resistance levels.


In technical analysis, the 200-day DMA is a long-term trend indicator. When the current price is below this level, it might signal a bearish trend or a downturn. While other aspect is that these leading stocks may be temporarily undervalued, presenting a potential buying opportunity for investors who believe the stock will revert to its mean or rise above the 200-day DMA again especially where the valuations are sane.


Near 52 week low but are good stocks fundamentally, If one would like to do some bottom fishing would be from one of these with sane valuations and sector uptrend.

Thanks for reading till now. I hope these 5-7 mins have added some value in your analysis.
Thanks,
Curious Investor
Disclaimer: The information provided in this article is for informational purposes only and should not be construed as investment advice. The analysis and insights presented are based on publicly available information, and while efforts have been made to ensure accuracy, we cannot guarantee the completeness or reliability of the information.
Investing in securities carries inherent risks. This post should not be relied upon as a substitute for independent research or consultation with a qualified financial advisor.
The author of this post and the platform on which it is published do not provide personalized investment recommendations or financial advisory services. Any investment or trading decisions you make based on the information provided in this post are solely at your own risk.
Neither the author nor the platform shall be held responsible or liable for any loss or damage arising directly or indirectly from the use of or reliance on the information contained in this post. Readers are encouraged to conduct their own due diligence and seek professional advice before making any investment decisions.
By accessing and reading this post, you acknowledge and agree to the terms and conditions outlined in this disclaimer.
Other Articles
Book Summary : 📚Outlive: The Science and Art of Longevity